The Relative Strength Index (RSI) stands as one of the most powerful and widely-used technical indicators in trading, offering beginner traders an effective tool to identify overbought and oversold market conditions. Developed by J. Welles Wilder in 1978, the Relative Strength Index (RSI) has become an essential component of successful trading strategies across all financial markets.
For beginner traders looking to master technical analysis, understanding RSI trading strategies provides a solid foundation for making informed trading decisions. The Relative Strength Index (RSI) oscillates between 0 and 100, offering clear signals that help traders identify potential entry and exit points in the market.
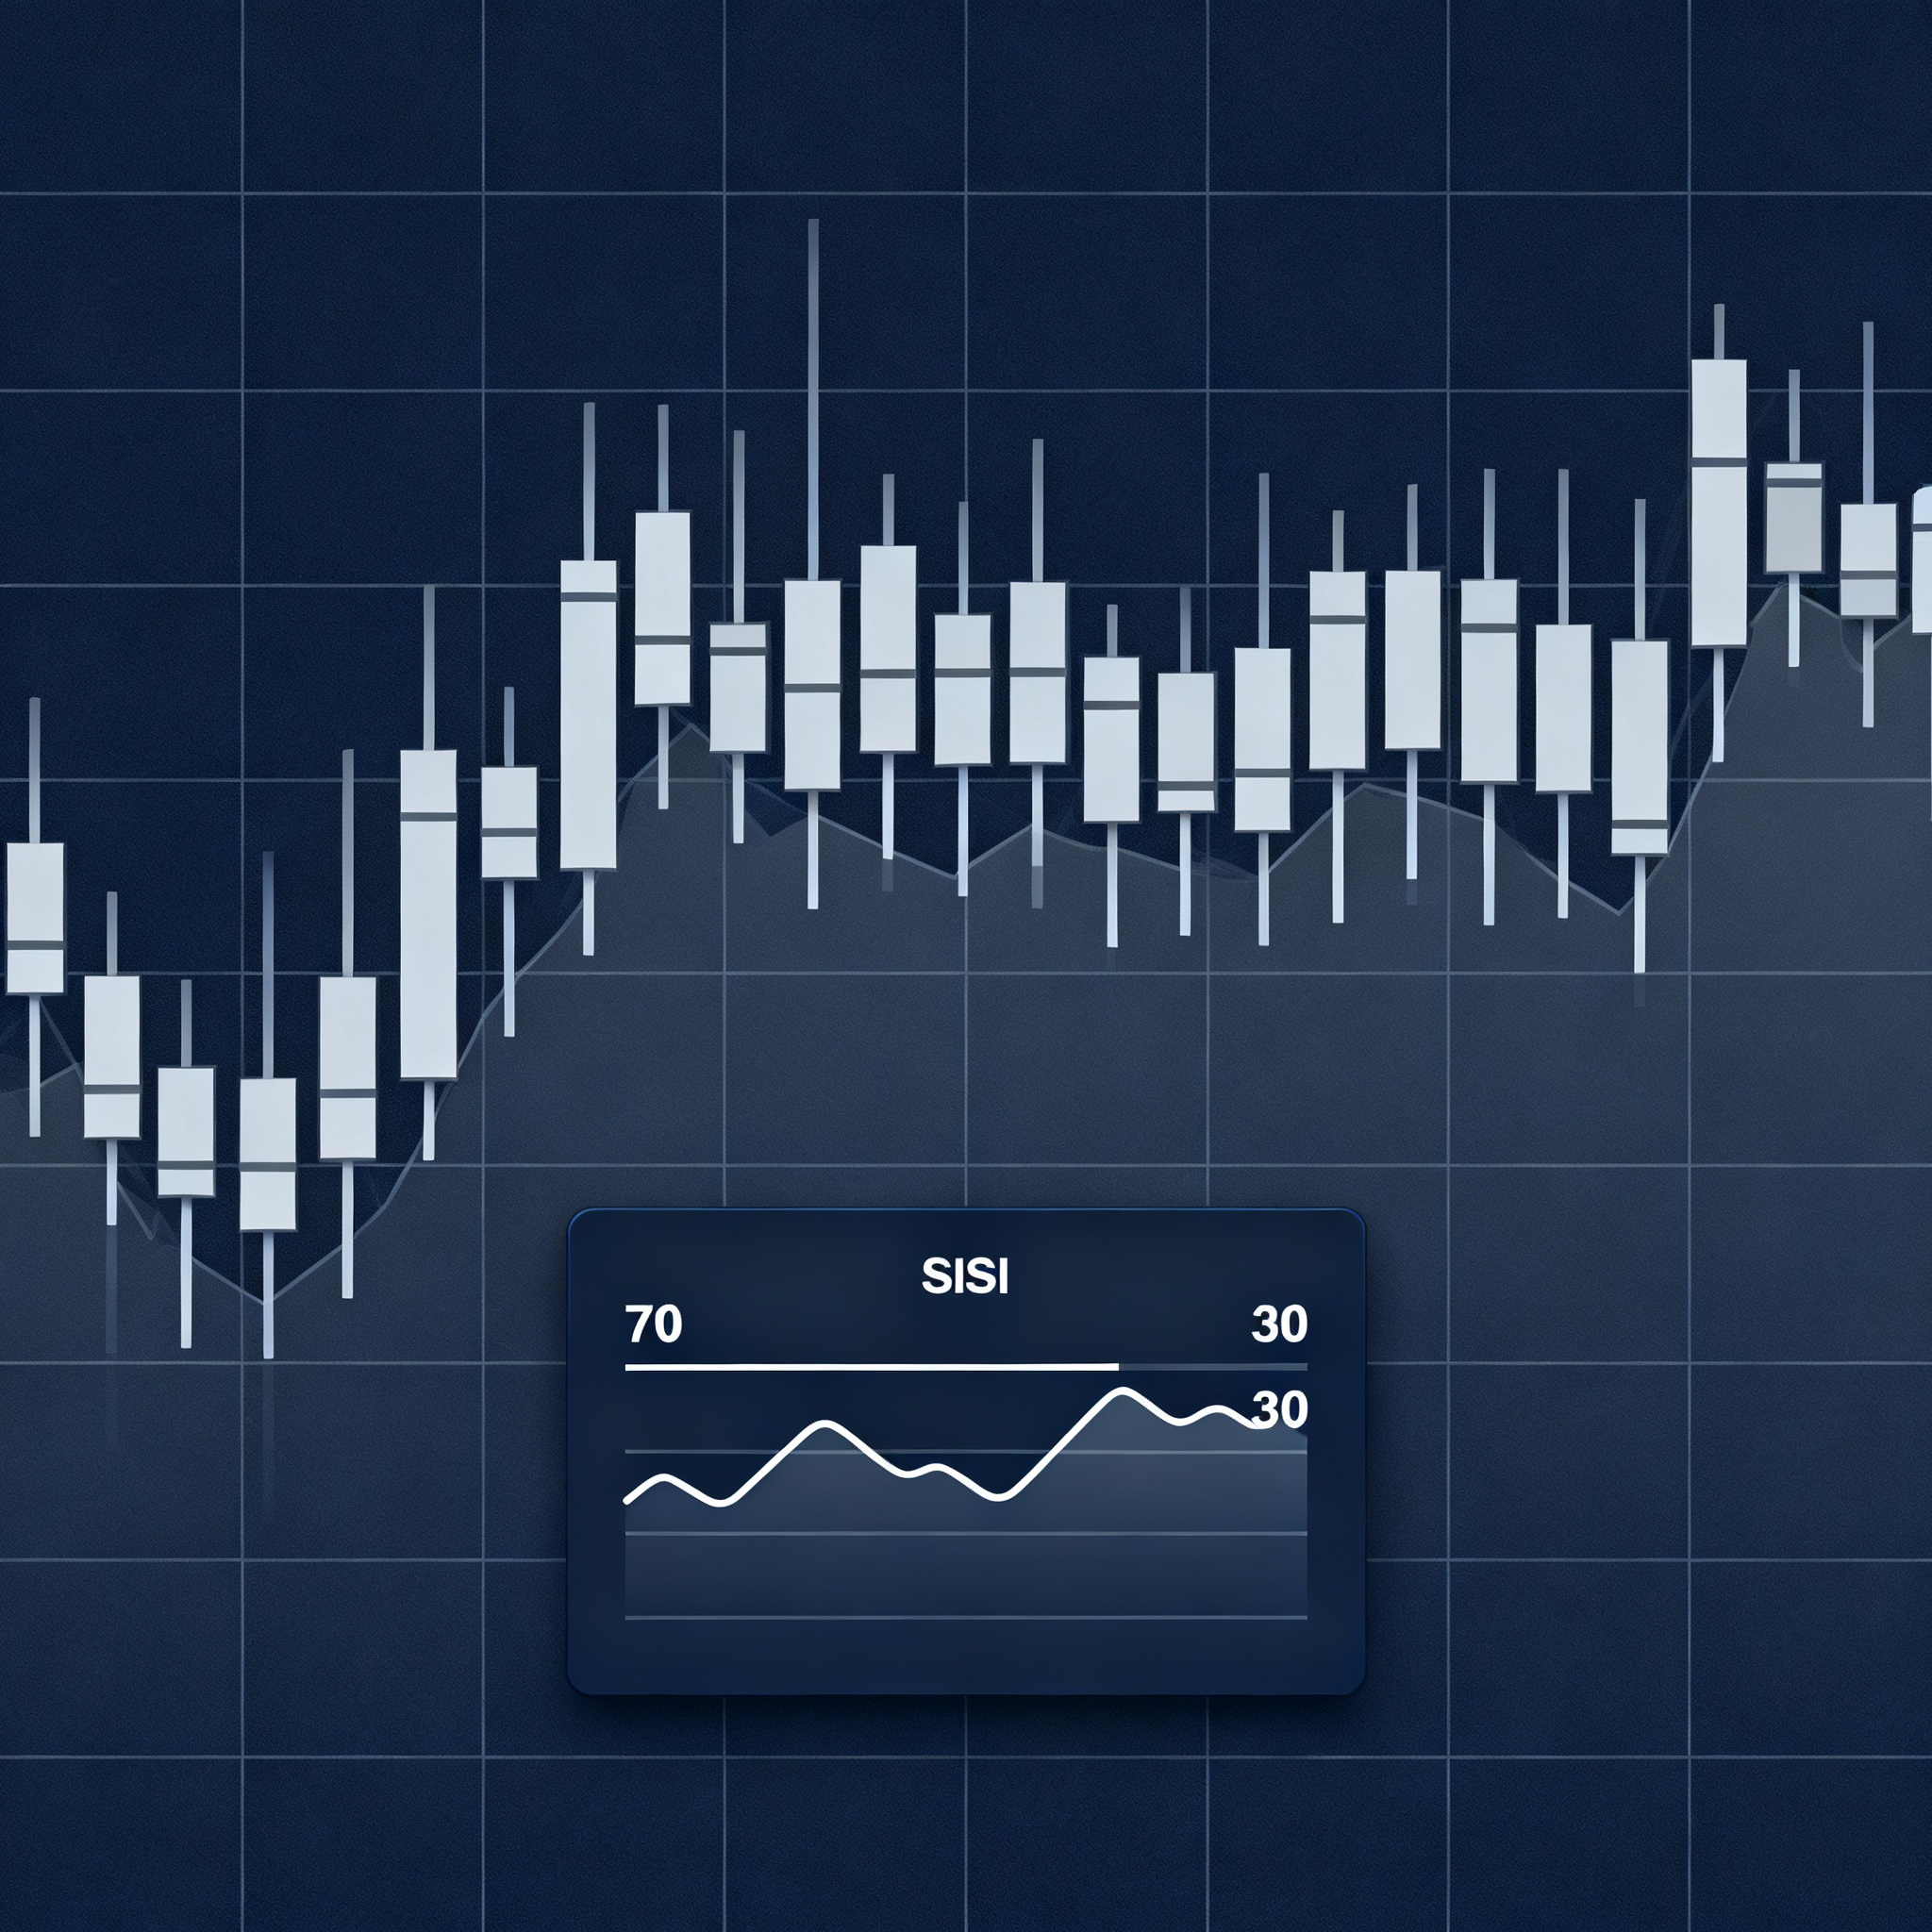
Professional RSI trading chart displaying technical analysis concepts for beginner traders
Professional RSI trading chart displaying technical analysis concepts for beginner traders
What is the Relative Strength Index (RSI)?
The Relative Strength Index (RSI) is a momentum oscillator that measures the speed and magnitude of price movements in financial markets. This RSI trading strategy indicator compares the average gains to average losses over a specified period, typically 14 days, to determine whether a security is overbought or oversold.
The Relative Strength Index (RSI) formula calculates momentum as the ratio of higher closes to overall closes, providing traders with valuable insights into market strength. Stocks with stronger positive changes will display a higher RSI value compared to stocks experiencing more negative changes.
Key Characteristics of RSI
The Relative Strength Index (RSI) operates within a range of 0 to 100, with specific levels indicating different market conditions:
- RSI values above 70 typically indicate overbought conditions
- RSI values below 30 suggest oversold conditions
- RSI readings around 50 represent neutral market momentum
- Values approaching 0 or 100 are rare but indicate extremely strong trends
RSI Calculation and Formula
Understanding how the Relative Strength Index (RSI) is calculated helps beginner traders appreciate the indicator’s reliability. The RSI calculation involves a two-step process that smooths price movements and provides accurate momentum readings.
Step-by-Step RSI Calculation
Step 1: Calculate Average Gains and Losses
- Identify price changes over the chosen period (usually 14 days)
- Separate upward price movements (gains) from downward movements (losses)
- Calculate the average gain and average loss over the period
Step 2: Apply the RSI Formula
textRSI = 100 - [100 / (1 + RS)]
Where RS (Relative Strength) = Average Gain / Average Loss
The Relative Strength Index (RSI) calculation considers only the magnitude of gains and losses, not their direction, making it an objective measure of price momentum for RSI trading strategies.
Understanding RSI Levels: Overbought and Oversold Conditions
The foundation of effective RSI trading strategies lies in understanding overbought and oversold levels. These Relative Strength Index (RSI) readings help beginner traders identify potential reversal points and optimal entry/exit opportunities.
Standard RSI Thresholds
Traditional RSI interpretation uses these key levels:
- Overbought Zone (70-100): Indicates strong buying pressure that may be unsustainable, suggesting potential selling opportunities
- Oversold Zone (0-30): Shows heavy selling pressure, indicating potential buying opportunities
- Neutral Zone (30-70): Represents balanced market conditions with moderate momentum
Adjusting RSI Levels for Different Markets
Successful RSI trading strategies require adjusting thresholds based on market conditions. The Relative Strength Index (RSI) behaves differently in trending versus ranging markets :
In Trending Markets:
- Strong uptrends: Use 80/40 levels instead of 70/30
- Strong downtrends: Consider 60/20 thresholds
- RSI can remain in extreme zones for extended periods during strong trends
In Ranging Markets:
- Standard 70/30 levels work effectively
- RSI oscillates more predictably between overbought and oversold zones
Core RSI Trading Strategies for Beginners
1. Basic Overbought/Oversold Strategy
The most fundamental RSI trading strategy involves buying when the Relative Strength Index (RSI) indicates oversold conditions and selling during overbought conditions.
Entry Rules:
- Buy when RSI drops below 30 (oversold)
- Sell when RSI rises above 70 (overbought)
- Wait for RSI to move back toward 50 before taking opposite positions
Risk Management:
- Place stop-losses below recent lows for long positions
- Set stop-losses above recent highs for short positions
- Target 2:1 risk-reward ratios for optimal profitability
2. RSI with Moving Average Crossover Strategy
This RSI trading strategy combines the Relative Strength Index (RSI) with moving averages to filter signals and improve accuracy.
Setup Requirements:
- Apply 10-day and 50-day moving averages to price chart
- Use standard 14-period RSI indicator
- Look for confluence between RSI signals and moving average crossovers
Trading Signals:
- Buy Signal: RSI above 30 AND short MA crosses above long MA
- Sell Signal: RSI below 70 AND short MA crosses below long MA
3. RSI Divergence Trading Strategy
RSI divergence represents one of the most powerful RSI trading strategies for identifying potential trend reversals. Divergence occurs when price action and the Relative Strength Index (RSI) move in opposite directions.
Types of RSI Divergence
Bullish Divergence:
- Price makes lower lows while RSI makes higher lows
- Typically occurs when RSI is below 30 (oversold)
- Suggests weakening selling pressure and potential upward reversal
Bearish Divergence:
- Price makes higher highs while RSI makes lower highs
- Usually happens when RSI is above 70 (overbought)
- Indicates fading buying pressure and possible downward reversal
Trading Divergence Signals:
- Wait for price confirmation before entering trades
- Use divergence as early warning of potential trend changes
- Combine with other technical indicators for validation
Advanced RSI Strategies
RSI Trendline Strategy
This RSI trading strategy involves drawing trendlines on the Relative Strength Index (RSI) itself to identify breakout opportunities.
Implementation:
- Draw trendlines connecting RSI peaks or troughs
- Look for RSI breakouts above or below these trendlines
- Confirm breakouts with corresponding price action
Multi-Timeframe RSI Analysis
Professional traders enhance their RSI trading strategies by analyzing multiple timeframes simultaneously.
Approach:
- Use daily charts for overall trend direction
- Apply hourly charts for entry timing
- Ensure RSI signals align across different timeframes for higher probability trades
RSI Settings and Optimization
Standard RSI Parameters
The default Relative Strength Index (RSI) setting of 14 periods works well for most RSI trading strategies, but adjustments can improve performance based on trading style.
For Different Trading Styles:
- Day Trading: 9-14 period RSI with 80/20 levels
- Swing Trading: 14-21 period RSI with 70/30 levels
- Scalping: 5-7 period RSI with 85/15 levels
Timeframe Considerations
RSI trading strategies perform differently across various timeframes, requiring appropriate adjustments :
- 5-minute charts: Use 9-10 period RSI for responsiveness
- 15-minute charts: Apply 7-10 period RSI with higher thresholds
- Daily charts: Standard 14-period RSI provides reliable signals
Risk Management in RSI Trading
Effective RSI trading strategies always incorporate proper risk management principles. The Relative Strength Index (RSI) provides entry signals, but protecting capital requires disciplined risk control.
Position Sizing
- Risk no more than 1-2% of trading capital per RSI signal
- Adjust position sizes based on RSI strength and market volatility
- Scale positions when multiple RSI signals align
Stop Loss Placement
For Long Positions:
- Place stops below recent swing lows when RSI indicates oversold conditions
- Use 1-2% stop losses for conservative risk management
For Short Positions:
- Set stops above recent swing highs during RSI overbought readings
- Adjust stops based on market volatility and timeframe
Common RSI Trading Mistakes to Avoid
1. Relying Solely on RSI Signals
The Relative Strength Index (RSI) works best when combined with other technical indicators and price action analysis. Beginner traders should avoid making decisions based exclusively on RSI readings.
2. Ignoring Market Context
RSI trading strategies must consider overall market trends and conditions. The Relative Strength Index (RSI) can remain overbought or oversold for extended periods during strong trending markets.
3. Using Wrong RSI Settings
Applying inappropriate RSI parameters for specific timeframes or market conditions reduces signal accuracy. Traders should optimize RSI settings based on their trading style and market analysis.
Combining RSI with Other Technical Indicators
RSI and MACD Combination
Combining the Relative Strength Index (RSI) with MACD creates powerful RSI trading strategies by providing both momentum and trend confirmation.
Signal Confirmation:
- RSI divergence + MACD crossover = Strong reversal signal
- RSI overbought + MACD bearish crossover = Reliable sell signal
RSI and Support/Resistance Levels
The Relative Strength Index (RSI) becomes more effective when used alongside key support and resistance levels.
Enhanced Strategy:
- Look for RSI oversold readings at major support levels
- Identify RSI overbought conditions at resistance zones
- Use price action confirmation for entry decisions
Practical RSI Trading Examples
Example 1: Buying Oversold Conditions
Scenario: A stock falls to ₹90 with RSI dropping to 25 (oversold)
Action: Consider buying as RSI signals oversold conditions
Outcome: Price rebounds to ₹100, validating the RSI signal
Example 2: Avoiding Overbought Markets
Scenario: A stock rises to ₹200 with RSI reaching 75 (overbought)
Action: Avoid buying as RSI indicates overbought conditions
Outcome: Price corrects to ₹180, confirming the RSI warning
Building Your RSI Trading Plan
Step 1: Choose Your Timeframe
Select appropriate timeframes for your RSI trading strategies based on your trading goals and availability :
- Short-term: 5-15 minute charts for day trading
- Medium-term: Hourly to 4-hour charts for swing trading
- Long-term: Daily charts for position trading
Step 2: Optimize RSI Parameters
Adjust Relative Strength Index (RSI) settings to match your chosen timeframe and trading style :
- Test different period lengths (7, 9, 14, 21)
- Modify overbought/oversold levels based on market volatility
- Backtest settings on historical data
Step 3: Define Entry and Exit Rules
Create clear rules for RSI trading strategies to maintain consistency :
Entry Criteria:
Exit Strategy:
- Profit targets based on risk-reward ratios
- Stop loss placement rules
- Partial profit-taking strategies
The Psychology of RSI Trading
Understanding market psychology enhances RSI trading strategies effectiveness. The Relative Strength Index (RSI) reflects collective market sentiment through price momentum measurements.
Overbought Psychology
When RSI reaches overbought levels, it indicates excessive bullish sentiment. Markets often become vulnerable to corrections as buying pressure becomes unsustainable.
Oversold Psychology
RSI oversold readings suggest extreme bearish sentiment. These conditions often create opportunities as selling pressure exhausts and buyers emerge.
Technology and RSI Trading
Modern trading platforms enhance RSI trading strategies through advanced features and automation:
RSI Alerts and Scanners
- Set RSI alerts for specific threshold breaches
- Use stock scanners to identify RSI opportunities across multiple markets
- Automate RSI divergence detection for efficiency
Backtesting RSI Strategies
Test Relative Strength Index (RSI) strategies on historical data to:
- Validate strategy effectiveness
- Optimize RSI parameters
- Understand strategy limitations and drawdowns
Trading Strategys website branding image with company information and URL
Trading Strategys website branding image with company information and URL
Key Takeaways for RSI Success
Mastering RSI trading strategies requires understanding that the Relative Strength Index (RSI) serves as a momentum indicator that measures price velocity and magnitude. Successful traders combine RSI signals with other technical analysis tools and maintain disciplined risk management.
The Relative Strength Index (RSI) proves most effective in ranging markets but can provide valuable signals in trending markets when properly adjusted. Beginner traders should start with standard 14-period RSI settings and gradually refine their approach through practice and experience.
Remember that RSI trading strategies work best when traders understand market context, use appropriate position sizing, and maintain realistic expectations about indicator performance. The Relative Strength Index (RSI) provides valuable insights into market momentum, but successful trading requires comprehensive analysis and disciplined execution.
Consistent profitability with RSI trading strategies comes from combining technical knowledge with practical experience, proper risk management, and continuous learning about market dynamics and indicator behavior.
Hashtags
#RSITrading #RelativeStrengthIndex #TradingStrategies #TechnicalAnalysis #StockMarket #TradingEducation #MomentumTrading #OverboughtOversold #TradingIndicators #BeginnerTrading #DayTrading #SwingTrading #TradingSignals #MarketAnalysis #TradingTips
Standard Disclaimer
This article is provided for educational purposes only and should not be considered as financial advice. RSI trading strategies and Relative Strength Index (RSI) analysis involve significant risks, and past performance does not guarantee future results.
Trading in financial markets carries substantial risk of loss and may not be suitable for all investors. Before implementing any RSI trading strategies, individuals should conduct thorough research, consider their financial situation and risk tolerance, and consult with qualified financial professionals.
The information presented about the Relative Strength Index (RSI) and related trading strategies is based on historical data and general market principles. Market conditions can change rapidly, and RSI signals may not always accurately predict future price movements.
Readers should never invest money they cannot afford to lose and should always use proper risk management techniques when implementing RSI trading strategies. The author and publisher disclaim any liability for financial losses that may result from the use of information contained in this educational content.
Always remember that successful trading requires continuous education, practice, and disciplined risk management beyond just understanding RSI trading strategies and technical indicators.