Trading Strategies

Trading Strategies

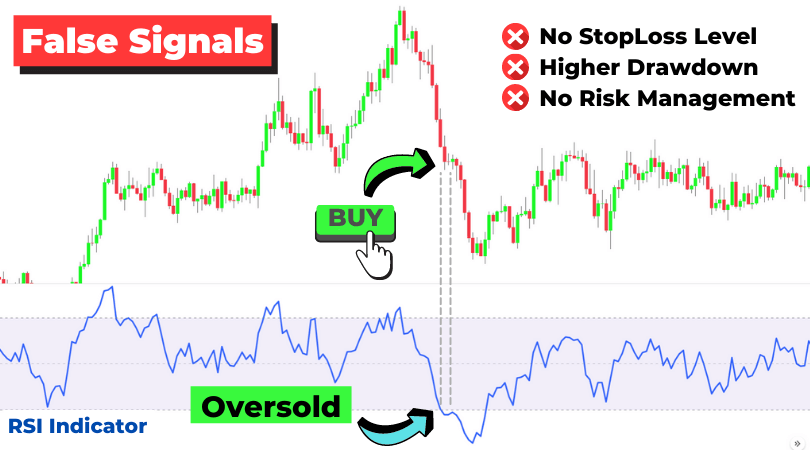
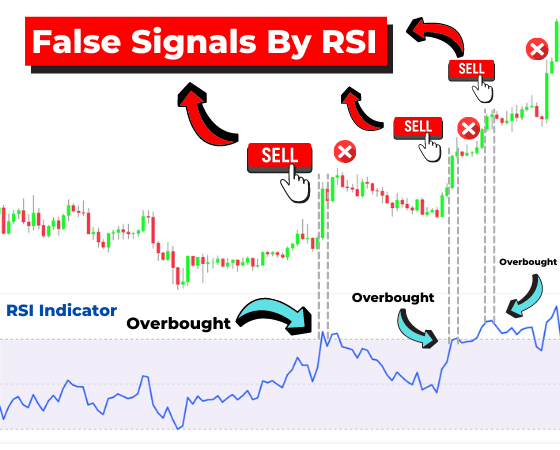
Stop Losing Money with Traditional Indicators – Discover More Effective Strategies!

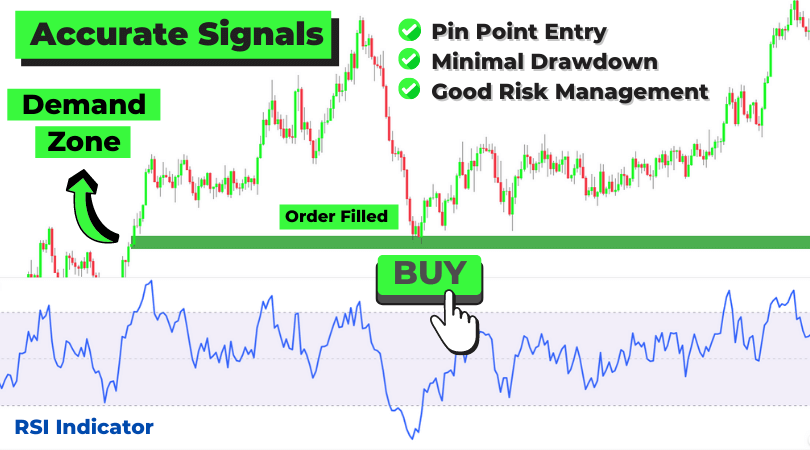
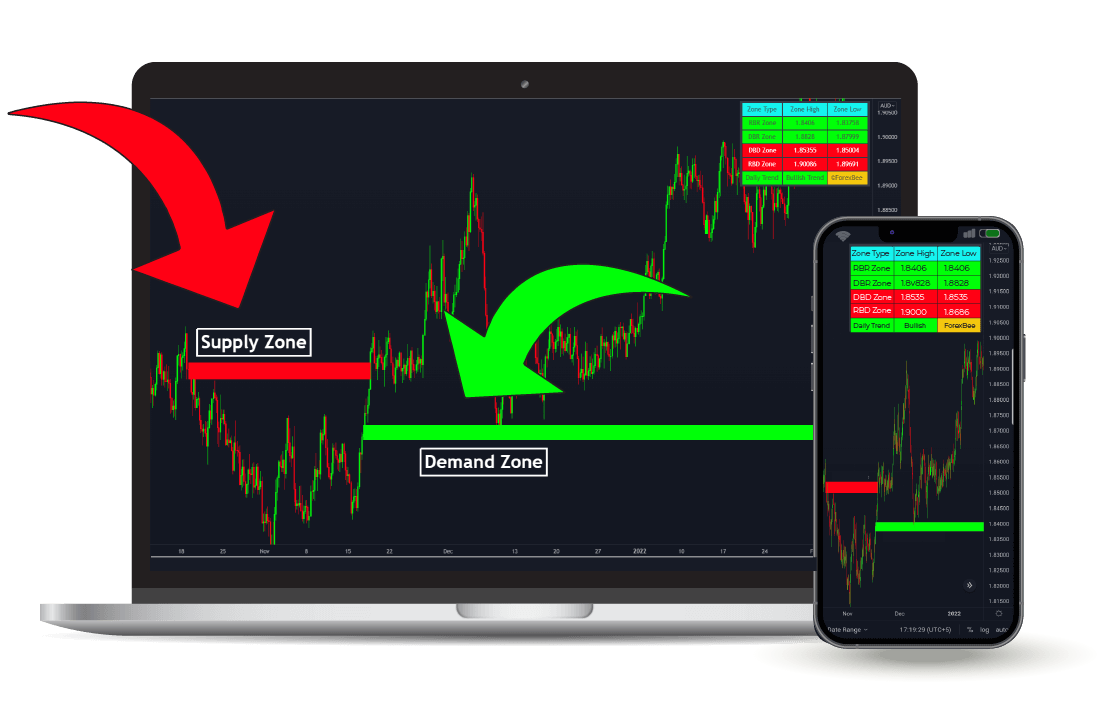
Unlock Hidden Opportunities and Maximize Your Trading Potential with the Power of the Supply & Demand Indicator. This innovative tool helps you identify key market levels where price reversals are likely to occur. By understanding supply and demand dynamics, you can make smarter, more informed decisions, improving your chances of success and reducing risks. Don't miss out on these powerful insights to enhance your trading strategy and boost profitability!

Features

Steady Monthly Income

Generate a consistent, stable monthly income with our proven trading strategies. Our system is designed to deliver reliable results, helping you achieve financial stability while minimizing risks.

Profit from Market Insights

Tap into powerful market insights with our unique approach, enabling you to make informed decisions and profit from every opportunity. Our strategies focus on high-probability trades for maximum returns

Maximize Earning Potential

Unlock your full earning potential with our comprehensive trading techniques. By utilizing advanced tools and indicators, you can enhance your trading skills and significantly increase your profits.

Why You Should Trade with Supply & Demand Indicator?

Trading Strategies

Trading with the Supply & Demand Indicator offers a strategic advantage by identifying key price levels where market reversals are likely. This powerful tool allows traders to make informed decisions, maximizing profit potential while minimizing risks. By focusing on high-probability trade opportunities, the Supply & Demand Indicator enhances precision and helps maintain effective risk management, making it an essential tool for any trader looking to improve their performance.

We Managed to Overcome One of the Biggest Challenges Faced by Traders


Most traders rely on basic mathematical formula-based indicators for their trading, but they often end up losing money. Why? Because these indicators, such as RSI, MACD, and Stochastic, always lag behind the price action. While you may use them to try and catch up with the market, they will inevitably be delayed in providing signals, meaning you miss the best opportunities and risk losing out on profits.


Why do people fail in trading by using lagging indicators?

  1. Delayed Signals: Lagging indicators, like RSI or MACD, react to price movements after they happen, which means traders miss out on key opportunities and are often too late to enter or exit positions.
  2. False Signals: Since lagging indicators are based on past price action, they can provide false or misleading signals, leading traders to make decisions that may not align with the current market trend.
  3. Missed Profit Potential: By waiting for a lagging indicator to signal a trade, traders often miss prime market conditions, which reduces the potential for maximizing profits.
  4. Chasing the Market: Lagging indicators force traders to chase the market instead of leading them to high-probability setups. This reactive approach can lead to higher risk and lower reward.
  5. Increased Risk: Relying solely on lagging indicators increases the risk of making trades at less optimal price levels, leading to larger drawdowns and poor risk-to-reward ratios.

Wasted Time And Money

Check out the image below to get a better picture of the situation.

Trading Strategies

Trust us, we speak from experience—we wasted a lot of time and money relying on traditional indicators before we finally found a better way. That’s why we developed our own indicator, "The Supply & Demand Indicator"! Unlike formula-based tools or mathematical tricks, it’s grounded in the fundamental laws of nature. Everything in nature follows the core principles of Supply & Demand, and our indicator reflects that truth for more accurate and reliable trading decisions.

Supply & Demand Trading in Technical Analysis

Now that you understand supply and demand are two fundamental laws of nature, applying them directly to forecast the market through technical analysis can be challenging.
To simplify this, we’ve divided these laws into two natural processes:

Impulsive Wave
A powerful market movement driven by an imbalance between supply and demand, where prices rapidly move in one direction.
Retracement Wave
A temporary reversal in price, often seen as a market correction, before the trend resumes in the original direction.

These processes help break down the complexity, making it easier to analyze market behavior.

Impulsive wave

Every market movement is driven by these two waves. After an impulsive wave, a retracement wave follows, and after the retracement wave, another impulsive wave forms. This cycle repeats indefinitely.

We’ve applied this natural process of supply and demand in a technical context.

For example, a "Rally-Base-Rally" pattern indicates an increase in demand in the market. In technical analysis terms, the impulsive wave represents the rally, the retracement wave represents the base, and the subsequent impulsive wave again represents the rally.

This creates the following formula:
Impulsive Wave + Retracement Wave + Impulsive Wave = Continuous Market Cycle
This formula illustrates the ongoing natural cycle of market movements based on supply and demand.

Impulsive wave + Retracement wave + Impulsive wave

When this pattern appears on the chart, it signals that demand has increased in the market, and prices are likely to rise. However, retail traders often struggle to accurately identify supply and demand zones because detecting waves can be difficult and inconsistent.
To address this challenge, we performed higher timeframe analysis, making it easier to spot supply and demand zones on the chart.

Continue Reading...

When you analyze an impulsive wave on a higher timeframe, you’ll notice a large candlestick with a bigger body compared to the previous 10-20 candlesticks. In other words, the body-to-wick ratio of the candlestick will be over 70%. This provides a clearer indication of the market’s direction, helping you identify strong supply and demand zones.

Here's the material you'll receive when you purchase "The Supply And Demand Indicator"

Trading Strategies
BONUS #1: Video Guide Bundle
In the video bundle, we’ll show you how to use the supply and demand indicator in simple yet powerful ways to help you trade more successfully. You will also get 8x trading strategy videos.

Value $67

Trading Strategies
BONUS #2: Ultimate PDF Guide
The PDF Guide is designed for traders to help them understand supply and demand analysis. We walk you through the basics, including which time frames to use and what to look for!

Value $67

Trading Strategies
BONUS #3: Psychological Indicator
The Psychological indicator will help you in holding a trade for longer to extract as much profit as possible from a trade.

Value $99

Trading Strategies 60-Days-Money-Back-Guarantee-PNG-Pic

There is ZERO RISK for you!

Purchase with confidence, backed by our 60-Day Money-Back Guarantee. If you're not completely satisfied, we’ll refund your money—no questions asked!

Frequently Asked Questions

Supply & Demand indicator works on any market including stocks, indices, forex, and commodities but we will recommend you to use this on Forex and Cryptocurrency because we have backtested the indicator on these two markets

In the video bundle and PDF, you will learn different strategies to trade the market.

After purchasing the plan, you will get instant access to the supply & demand indicator.

It works on the free plan of Tradingview, you don’t need to upgrade.

You will also receive a link to join Facebook community of traders to stay updated about the indicator and supply demand methods.

If you don’t know your tradingview username then click here.

Not at all. This indicator is created for those traders who are not only serious about their careers but also want to succeed.

YES! You are protected by our iron-clad 60-day money-back guarantee. If you decide to get a refund, let us know and we’ll deactivate your account and immediately give you your money right back! If you have a technical issue, again, let us know and we will be super happy to help and fix it ASAP!

Price Plans

Make sure you select a plan that fits your needs and commitments.

Trading Strategies

Safe & Secure Checkout.
No commitments. Cancel anytime with one click in your account.

Premium SnD Indicator on TradingView

Acess to Premium Facebook Community

Psychological indicator

Real-time Alerts

PDF Manual & Video Bundle

24/7 Support & Product Updates

Trading Strategies

Offer For Today Only

© Copyright 2025 Trading Strategys. All Rights Reserved.