Fibonacci Trading Strategy: Master the Golden Ratio for Market Success
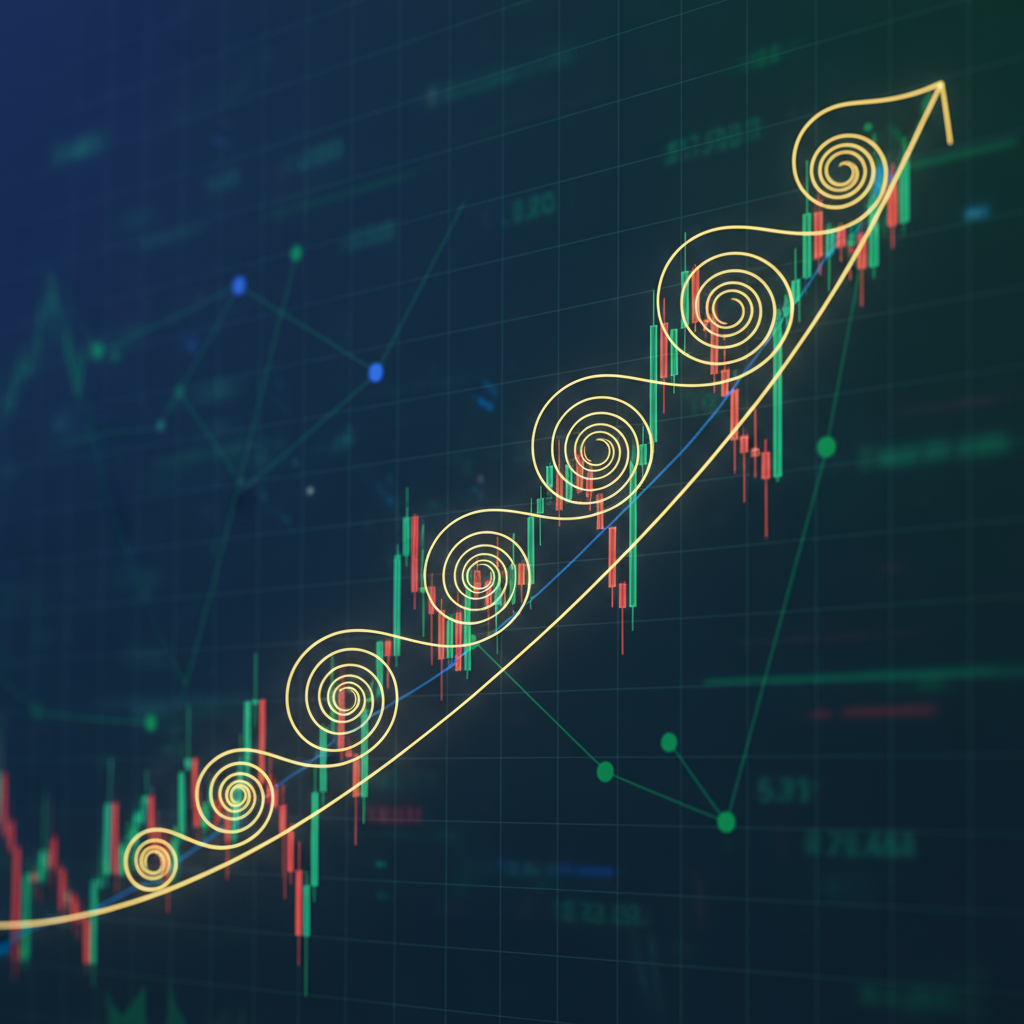
The fibonacci trading strategy represents one of the most sophisticated yet accessible mathematical approaches to analyzing financial markets. Based on the renowned Fibonacci sequence discovered by Leonardo Pisano in the 13th century, this fibonacci trading strategy utilizes natural mathematical ratios that appear throughout nature, architecture, and human behavior to predict potential price movements in stocks, forex, and other financial instruments.
At its core, the fibonacci trading strategy leverages the golden ratio (1.618) and its inverse (0.618) to identify critical support and resistance levels where prices are likely to reverse or consolidate. Professional traders worldwide rely on this fibonacci trading strategy because it provides objective, mathematically-based reference points that help remove emotional decision-making from trading.
Understanding the Fibonacci Sequence and Golden Ratio
The fibonacci trading strategy originates from the Fibonacci sequence: 0, 1, 1, 2, 3, 5, 8, 13, 21, 34, 55, 89, 144, and so forth. Each number in this sequence equals the sum of the two preceding numbers, creating ratios that appear consistently in natural phenomena.
When applied to the fibonacci trading strategy, these mathematical relationships translate into key percentage levels:
- 23.6% – Shallow retracement indicating strong momentum
- 38.2% – Common retracement level for trending markets
- 50% – Psychological midpoint (not technically a Fibonacci ratio)
- 61.8% – The golden ratio, most significant retracement level
- 78.6% – Deep retracement suggesting potential trend reversal
The fibonacci trading strategy works because these levels represent zones where market psychology and mathematical precision intersect, creating high-probability reversal points that institutional traders monitor closely.
Core Components of Fibonacci Trading Strategy
Fibonacci Retracement Levels
Fibonacci retracement forms the foundation of any effective fibonacci trading strategy. These horizontal lines indicate potential support and resistance areas where price corrections might reverse before continuing in the original trend direction.
To implement fibonacci retracement in your fibonacci trading strategy:
- Identify the trend direction – Determine if the market shows higher highs and higher lows (uptrend) or lower highs and lower lows (downtrend)
- Select swing points – Choose the most significant recent swing high and swing low on your chart
- Apply the tool – In uptrends, draw from swing low to swing high; in downtrends, draw from swing high to swing low
- Monitor price action – Watch for price reactions at key fibonacci retracement levels, particularly 38.2%, 50%, and 61.8%
The fibonacci trading strategy using retracements works best in trending markets where prices pull back temporarily before resuming the primary direction.
Fibonacci Extensions for Profit Targets
Fibonacci extensions complement retracements in a comprehensive fibonacci trading strategy by projecting potential price targets beyond the original trend move. These levels help traders set realistic profit objectives and identify where trends might exhaust.
Key fibonacci extension levels include:
- 127.2% – First extension target for moderate moves
- 161.8% – Primary extension level based on golden ratio
- 261.8% – Extended target for strong momentum moves
- 423.6% – Extreme extension suggesting trend exhaustion
Professional traders integrate fibonacci extensions into their fibonacci trading strategy to scale out positions systematically and maximize profits during trending moves.
Advanced Fibonacci Tools
A complete fibonacci trading strategy incorporates additional tools beyond basic retracements and extensions:
Fibonacci Arcs add a time element to traditional analysis by creating curved support and resistance levels that evolve as time progresses. These half-circles extend from trend lines at key Fibonacci ratios, providing dynamic reference points for price reversals.
Fibonacci Fans create diagonal support and resistance lines by dividing a trend move into Fibonacci ratios and projecting diagonal lines from the starting point. This fibonacci trading strategy tool helps identify sloping support and resistance areas.
Fibonacci Time Zones apply the sequence to time analysis, projecting vertical lines at Fibonacci intervals to anticipate when significant price movements might occur. This temporal aspect of the fibonacci trading strategy helps traders time their entries and exits more precisely.
Implementing Fibonacci Trading Strategy in Practice
Entry Point Identification
Successful implementation of any fibonacci trading strategy requires systematic entry point identification. The most effective approach combines fibonacci retracement levels with additional confirmation signals:
Confluence trading represents the cornerstone of professional fibonacci trading strategy execution. This approach waits for multiple technical factors to align at key Fibonacci levels:
- Price reaching a significant fibonacci retracement level (38.2%, 50%, or 61.8%)
- Candlestick reversal patterns forming at the Fibonacci zone
- Volume increase confirming institutional interest
- Additional technical indicators (RSI, MACD) showing oversold/overbought conditions
Golden Zone Strategy focuses specifically on the area between 50% and 61.8% fibonacci retracement levels, where the highest probability reversals typically occur. This fibonacci trading strategy approach provides traders with a concentrated area to monitor for entry opportunities.
Risk Management in Fibonacci Trading Strategy
Effective fibonacci trading strategy implementation demands disciplined risk management protocols. Professional traders use Fibonacci levels not only for entries but also for systematic risk control:
Stop-loss placement in a fibonacci trading strategy typically occurs just beyond the next Fibonacci level. For example, if entering at the 61.8% retracement, place the stop-loss below the 78.6% level to allow for minor fluctuations while protecting against significant adverse moves.
Position sizing within a fibonacci trading strategy should account for the distance between entry and stop-loss levels. Larger distances between Fibonacci levels require smaller position sizes to maintain consistent risk per trade.
Partial profit-taking using fibonacci extensions allows traders to secure gains systematically. Consider taking partial profits at the 127.2% extension while letting remaining positions run toward the 161.8% target.
Market Psychology Behind Fibonacci Trading Strategy
Why Fibonacci Levels Create Market Reactions
The effectiveness of any fibonacci trading strategy stems from the intersection of mathematical precision and market psychology. These levels work because they represent natural psychological zones where traders make collective decisions.
Self-fulfilling prophecy plays a crucial role in fibonacci trading strategy success. When thousands of traders monitor the same fibonacci retracement and extension levels, their collective actions create increased buying or selling pressure at these zones, making the levels more likely to hold.
Institutional behavior significantly impacts fibonacci trading strategy effectiveness. Large financial institutions use sophisticated algorithms that incorporate Fibonacci analysis, creating substantial order flow at key levels that generates the price reactions retail traders observe.
Behavioral Finance Aspects
The fibonacci trading strategy succeeds partly because it aligns with fundamental aspects of human psychology in financial markets:
Loss aversion causes traders to react more strongly to potential losses than equivalent gains, leading to clustering of stop-loss orders near key fibonacci retracement levels.
Anchoring bias makes traders fixate on recent highs and lows when applying fibonacci retracement tools, creating consensus around specific swing points that enhance level significance.
Pattern recognition drives human tendency to find meaning in mathematical relationships, making fibonacci trading strategy particularly appealing to both novice and experienced traders.
Advantages of Fibonacci Trading Strategy
Objective Analysis Framework
The fibonacci trading strategy provides traders with an objective, mathematically-based framework for market analysis that reduces emotional decision-making:
Precise level identification eliminates guesswork in determining potential support and resistance zones. Unlike subjective trend lines, fibonacci retracement levels provide exact price points for monitoring.
Universal applicability makes the fibonacci trading strategy effective across all financial markets and timeframes. Whether trading stocks, forex, commodities, or cryptocurrencies, the same principles apply consistently.
Risk-reward optimization becomes more systematic when using fibonacci extensions to set profit targets. This fibonacci trading strategy approach helps traders maintain favorable risk-reward ratios across multiple trades.
Enhanced Market Timing
Professional implementation of fibonacci trading strategy significantly improves market timing accuracy:
Reversal zone identification helps traders avoid chasing price movements by providing specific areas to wait for pullbacks in trending markets.
Confluence opportunities multiply when fibonacci trading strategy levels align with other technical analysis tools, creating high-probability setups with improved success rates.
Multi-timeframe analysis enhances fibonacci trading strategy effectiveness by using higher timeframes to identify major levels while using lower timeframes for precise entry timing.
Limitations and Risks of Fibonacci Trading Strategy
Common Pitfalls
Despite its mathematical foundation, the fibonacci trading strategy contains inherent limitations that traders must understand:
Subjectivity in swing point selection represents the primary weakness of any fibonacci trading strategy. Different traders may identify different swing highs and lows, leading to varying fibonacci retracement levels and conflicting signals.
False signals occur regularly in fibonacci trading strategy implementation, particularly when price approaches but doesn’t reach expected levels or breaks through levels without significant reactions.
Lagging nature of fibonacci retracement tools means they’re based on historical price data and cannot predict future market movements with certainty.
Market Condition Dependencies
The fibonacci trading strategy performs differently across various market conditions:
Trending markets provide the ideal environment for fibonacci trading strategy success, as retracements and extensions work best when clear directional bias exists.
Sideways markets significantly reduce fibonacci trading strategy effectiveness, as the lack of clear trends makes swing point identification difficult and reduces level reliability.
High volatility periods can cause price to gap through fibonacci retracement levels without providing opportunities for entries, particularly during news events or market stress.
Fibonacci Trading Strategy Best Practices
Confirmation and Confluence
Professional fibonacci trading strategy implementation always seeks confirmation from multiple sources before executing trades:
Price action confirmation through candlestick patterns, particularly at key fibonacci retracement levels, significantly improves trade success rates. Look for hammers, doji, or engulfing patterns at Fibonacci zones.
Volume analysis provides crucial confirmation for fibonacci trading strategy setups. Increased volume at fibonacci retracement levels suggests institutional interest and higher probability of price reactions.
Multiple timeframe analysis strengthens fibonacci trading strategy execution by identifying major levels on higher timeframes while using lower timeframes for precise entry timing.
Technology and Tools
Modern fibonacci trading strategy implementation benefits from advanced technology and platforms:
Automated level calculation eliminates manual drawing errors and ensures consistent fibonacci retracement level placement across different charts and timeframes.
Alert systems notify traders when price approaches key fibonacci trading strategy levels, ensuring opportunities aren’t missed during busy market periods.
Backtesting capabilities allow traders to validate their fibonacci trading strategy rules using historical data before risking real capital.
Advanced Fibonacci Trading Strategy Techniques
Professional Integration Methods
Experienced traders enhance their fibonacci trading strategy by combining it with institutional trading concepts:
Fair value gaps aligned with fibonacci retracement levels create powerful confluence zones where smart money often accumulates positions.
Order block analysis combined with fibonacci trading strategy helps identify areas where institutional traders have established significant positions.
Market structure breaks confirmed by fibonacci extension levels provide high-conviction continuation signals in trending markets.
Psychological Mastery
Advanced fibonacci trading strategy success requires psychological discipline beyond technical knowledge:
Patience for confirmation prevents premature entries at fibonacci retracement levels without additional supporting evidence.
Emotional detachment from individual trades allows traders to follow their fibonacci trading strategy rules consistently, even when setups look uncomfortable.
Systematic execution removes discretionary decision-making by following predetermined fibonacci trading strategy protocols regardless of market noise.
Conclusion
The fibonacci trading strategy represents a sophisticated yet accessible approach to financial market analysis that combines mathematical precision with market psychology. By understanding and properly implementing fibonacci retracement levels, extensions, and advanced tools like arcs and fans, traders can significantly improve their market timing and risk management.
Success with any fibonacci trading strategy requires recognition of both its strengths and limitations. While these mathematical levels provide valuable reference points for support, resistance, and profit targets, they work best when combined with additional confirmation signals and proper risk management protocols.
The key to profitable fibonacci trading strategy implementation lies in patience, discipline, and systematic application of proven principles. Rather than viewing Fibonacci levels as magical price magnets, professional traders use them as probability-based zones where careful analysis and confirmation can lead to high-quality trading opportunities.
Whether you’re a beginning trader learning technical analysis or an experienced professional seeking to refine your approach, the fibonacci trading strategy offers a mathematically-grounded framework for navigating financial markets with greater confidence and precision.
Keywords: fibonacci trading strategy, fibonacci retracement, golden ratio trading, technical analysis, support resistance levels, market psychology, trading psychology, risk management
Hashtags: #FibonacciTrading #TechnicalAnalysis #StockMarket #TradingStrategy #GoldenRatio #SupportResistance #TradingEducation #MarketAnalysis #TradingTips #InvestmentStrategy
Disclaimer: This article is provided for educational purposes only and should not be considered as financial advice. Trading in financial markets involves substantial risk and may not be suitable for all investors. Past performance does not guarantee future results. Always conduct your own research and consider consulting with a qualified financial advisor before making any investment decisions. The author and Trading Strategys are not responsible for any losses incurred from trading based on the information provided in this article.