
Master Candlestick Indicators: Your Complete Guide to Technical Analysis Trading Patterns
Candlestick indicators represent one of the most powerful and visually intuitive tools in technical analysis, providing traders with deep insights into market psychology and price movement patterns. These remarkable visual representations have revolutionized how traders analyze financial markets, offering a comprehensive view of opening, closing, high, and low prices within a single graphical element. Understanding candlestick indicators is essential for any trader seeking to develop profitable trading strategies and make informed investment decisions in today’s dynamic financial markets.
Understanding the Foundation of Candlestick Indicators
Candlestick indicators originated from Japanese rice traders over 400 years ago and have become the cornerstone of modern technical analysis. Each candlestick pattern tells a unique story about market sentiment, revealing the ongoing battle between buyers and sellers during specific trading periods. The beauty of candlestick indicators lies in their ability to compress complex market information into easily digestible visual formats that traders can quickly interpret and act upon.
The fundamental structure of candlestick indicators consists of three critical components that work together to provide comprehensive market insights. The body represents the range between opening and closing prices, with green or white bodies indicating bullish movement where closing prices exceed opening prices, while red or black bodies signal bearish sentiment with closing prices below opening prices. The shadows or wicks extend above and below the body, marking the highest and lowest prices reached during the trading session, providing valuable information about market volatility and price rejection levels. The color offers immediate visual confirmation of price direction, enabling traders to quickly assess market momentum and sentiment shifts.
Essential Single Candlestick Indicator Patterns
The Hammer Pattern: A Powerful Bullish Reversal Signal
The hammer represents one of the most reliable single candlestick indicators for identifying potential trend reversals. This pattern features a small body positioned at the upper end of the trading range, accompanied by a long lower wick that extends significantly below the body, typically twice the length of the body itself. Hammer candlestick indicators appear most effectively at the bottom of downtrends, suggesting that despite initial selling pressure, strong buying interest emerged to push prices higher from their lows.
When hammer candlestick indicators form after extended downtrends, they signal that selling pressure is diminishing and buyers are beginning to assert control over market direction. The long lower wick demonstrates that bears attempted to drive prices lower but ultimately failed as bulls stepped in to support the asset at lower levels. This buying pressure creates the characteristic hammer shape, indicating a potential shift from bearish to bullish sentiment that traders can capitalize upon.
The Doji: Market Indecision and Potential Reversal
Doji candlestick indicators represent periods of market equilibrium where opening and closing prices are nearly identical, creating a cross-like appearance on the chart. These patterns reveal critical moments of indecision between buyers and sellers, often preceding significant price movements in either direction. Doji candlestick indicators become particularly significant when they appear after extended trends, suggesting that the prevailing momentum may be exhausting itself.
The power of doji candlestick indicators lies in their ability to signal potential trend reversals or consolidation periods. When doji patterns emerge near key support or resistance levels, they often precede substantial price movements as market participants resolve their indecision. Traders who recognize these candlestick indicators can position themselves advantageously before major price breakouts or reversals occur.
The Shooting Star: Identifying Bearish Reversal Opportunities
Shooting star candlestick indicators provide powerful bearish reversal signals when they appear at the top of uptrends. These patterns feature small bodies positioned near the lower end of the trading range, accompanied by long upper wicks that extend significantly above the body. The shooting star formation indicates that buyers initially pushed prices higher but encountered strong selling pressure that drove prices back down near the opening level.
Shooting star candlestick indicators reveal critical information about market psychology and potential trend exhaustion. The long upper wick demonstrates that bulls attempted to extend the uptrend but failed to maintain higher prices as bears overwhelmed buying pressure. This rejection of higher prices often signals the beginning of bearish reversals, providing traders with excellent short-selling opportunities when confirmed by additional technical factors.
Multi-Candlestick Indicator Patterns
Bullish Engulfing: Powerful Trend Reversal Signal
Bullish engulfing patterns rank among the most reliable multi-candlestick indicators for identifying trend reversals. This two-candlestick formation consists of a smaller bearish candle followed by a larger bullish candle that completely engulfs the previous candle’s body. The bullish engulfing pattern demonstrates a decisive shift in market sentiment as buyers overwhelm sellers and establish control over price direction.
The effectiveness of bullish engulfing candlestick indicators stems from their clear demonstration of changing market dynamics. The first candle shows continued bearish pressure, while the second candle reveals that bulls have not only absorbed all selling pressure but have driven prices significantly higher. This dramatic reversal in sentiment often marks the beginning of substantial uptrends, making bullish engulfing patterns valuable trading signals for long positions.
Bearish Engulfing: Identifying Downward Trend Reversals
Bearish engulfing candlestick indicators mirror their bullish counterparts but signal potential downward reversals. This pattern features a smaller bullish candle followed by a larger bearish candle that completely engulfs the previous candle’s body. Bearish engulfing patterns typically appear at the end of uptrends, indicating that selling pressure has overwhelmed buying interest and bears are gaining control of market direction.
The significance of bearish engulfing candlestick indicators lies in their demonstration of rapidly changing market sentiment. These patterns show that despite initial bullish momentum, bears successfully reversed the trend and established downward pressure. Traders who recognize bearish engulfing patterns can capitalize on short-selling opportunities or exit long positions before significant declines occur.
Morning Star and Evening Star: Three-Candle Reversal Patterns
Morning star and evening star patterns represent sophisticated three-candlestick indicators that provide highly reliable reversal signals. The morning star appears at the bottom of downtrends and consists of a long bearish candle, followed by a small-bodied candle (often a doji), and concluding with a long bullish candle that closes above the midpoint of the first candle’s body. This pattern indicates the transition from bearish to bullish sentiment as selling pressure subsides and buying interest emerges.
Evening star candlestick indicators work in reverse, appearing at the top of uptrends and signaling potential bearish reversals. This pattern begins with a long bullish candle, followed by a small-bodied candle that gaps higher, and concludes with a long bearish candle that closes below the midpoint of the first candle’s body. Evening star patterns demonstrate the exhaustion of bullish momentum and the emergence of bearish sentiment, providing excellent opportunities for short positions or long position exits.
Advanced Candlestick Indicator Strategies
Combining Candlestick Indicators with Technical Analysis
The true power of candlestick indicators emerges when traders combine them with other technical analysis tools and market factors. Support and resistance levels provide crucial context for candlestick patterns, as reversal signals become significantly more reliable when they occur at key price levels. When hammer or doji candlestick indicators appear at major support levels, they offer high-probability bullish reversal opportunities that traders can exploit with favorable risk-reward ratios.
Volume analysis enhances the reliability of candlestick indicators by confirming the strength of price movements. High volume accompanying bullish engulfing or morning star patterns validates the buying pressure behind the reversal, while low volume may suggest weak conviction and higher probability of false signals. Traders who incorporate volume analysis with candlestick indicators can filter out weaker signals and focus on high-probability trading opportunities.
Multiple Timeframe Analysis with Candlestick Indicators
Successful traders utilize candlestick indicators across multiple timeframes to gain comprehensive market perspectives and improve signal accuracy. Daily candlestick indicators provide primary trend direction and major reversal signals, while hourly patterns offer precise entry and exit timing. When daily hammer patterns align with hourly bullish engulfing signals, traders can enter positions with high confidence and optimal timing.
Weekly candlestick indicators reveal longer-term market sentiment and major trend changes that may not be apparent on shorter timeframes. Morning star patterns on weekly charts often signal substantial trend reversals that can provide profit opportunities lasting several months. By analyzing candlestick indicators across multiple timeframes, traders can align their positions with both short-term momentum and long-term trends.
Psychology Behind Candlestick Indicators
Understanding Market Sentiment Through Candlestick Patterns
Candlestick indicators provide unique insights into market psychology by visually representing the emotional states of market participants. Fear and greed drive most market movements, and these emotions become clearly visible through candlestick patterns. Hammer patterns at market bottoms reveal moments when fear reaches extremes and value buyers begin to emerge, while shooting star patterns at market tops show greed reaching unsustainable levels before reality sets in.
The battle between bulls and bears plays out dramatically through candlestick indicators, providing traders with real-time insights into shifting market dynamics. Engulfing patterns demonstrate decisive victories by one side over the other, while doji patterns reveal moments of equilibrium where neither side maintains clear control. Understanding these psychological dynamics helps traders anticipate market movements and position themselves advantageously.
Emotional Cycles and Candlestick Pattern Recognition
Market emotions follow predictable cycles that manifest through recurring candlestick indicator patterns. Accumulation phases often feature numerous hammer and bullish engulfing patterns as smart money quietly builds positions while retail traders remain fearful. Distribution phases frequently display shooting star and bearish engulfing patterns as institutional investors begin selling into retail buying enthusiasm.
Recognizing these emotional cycles through candlestick indicators enables traders to align their strategies with market psychology rather than fighting against it. By identifying when fear or greed reaches extreme levels through pattern recognition, traders can position themselves to profit from inevitable emotional reversals that drive significant price movements.
Risk Management with Candlestick Indicators
Setting Stop-Loss Levels Using Candlestick Patterns
Effective risk management requires strategic stop-loss placement based on candlestick indicator signals and market structure. Hammer patterns suggest placing stop-losses below the long lower wick, as price movement below this level would invalidate the bullish reversal signal. Bullish engulfing patterns indicate stop-loss placement below the low of the engulfing candle, providing clear invalidation levels for the reversal thesis.
Shooting star patterns offer natural stop-loss levels above the long upper wick for short positions, as price movement above this level would negate the bearish reversal signal. By using candlestick indicators to define risk levels, traders can maintain disciplined risk management while allowing their profitable positions sufficient room to develop.
Position Sizing and Candlestick Signal Strength
The strength and reliability of candlestick indicators should influence position sizing decisions to optimize risk-adjusted returns. Strong reversal patterns like morning stars at major support levels justify larger position sizes due to their high probability of success and favorable risk-reward ratios. Weaker signals or patterns occurring in neutral market conditions warrant smaller position sizes to account for increased uncertainty.
Volume confirmation, pattern clarity, and market context all contribute to signal strength assessment. Candlestick indicators with high volume, clear pattern definition, and occurrence at key levels deserve more aggressive position sizing, while ambiguous patterns in neutral markets require conservative approaches to preserve capital for higher-probability opportunities.
Common Mistakes with Candlestick Indicators
Avoiding False Signals and Overtrading
Many traders fall into the trap of acting on every candlestick indicator signal without considering market context or confirmation factors. Isolated patterns occurring in the middle of trading ranges often produce false signals that lead to losses and frustration. Successful traders focus on candlestick indicators that appear at significant support, resistance, or trend levels where reversal probabilities are highest.
Overtrading represents another common mistake where traders attempt to capitalize on every perceived candlestick pattern regardless of signal quality. This approach leads to excessive transaction costs and positions in low-probability setups. Disciplined traders wait for high-quality candlestick indicator signals that offer favorable risk-reward ratios and strong confirmation factors.
The Importance of Market Context
Candlestick indicators must be interpreted within the broader market context to avoid costly mistakes. Bullish patterns during strong downtrends may only produce temporary bounces rather than sustainable reversals, while bearish patterns in robust uptrends often result in minor corrections before trend resumption. Understanding the larger trend direction helps traders interpret candlestick indicators more accurately.
Economic events and fundamental factors can override technical signals, making market context crucial for successful candlestick pattern trading. Earnings announcements, central bank decisions, and geopolitical developments can invalidate even the most reliable candlestick indicators. Successful traders consider both technical and fundamental factors when making trading decisions based on pattern recognition.
Trading Systems Using Candlestick Indicators
Developing Systematic Approaches
Professional traders develop systematic approaches that incorporate candlestick indicators with clear entry, exit, and risk management rules. Pattern scanning techniques help identify high-probability setups across multiple markets and timeframes, allowing traders to focus their attention on the most promising opportunities. These systematic approaches remove emotional decision-making and improve consistency in trading results.
Backtesting candlestick indicator strategies provides valuable insights into pattern reliability and optimal trading parameters. Historical analysis reveals which patterns perform best in different market conditions and helps traders refine their approaches for maximum profitability. Systematic backtesting also identifies optimal stop-loss levels, profit targets, and position sizing rules for various candlestick patterns.
Integration with Modern Trading Tools
Today’s traders can leverage advanced software and algorithms to enhance their candlestick indicator analysis. Automated scanning tools identify pattern formations across thousands of instruments simultaneously, ensuring traders never miss high-probability opportunities. These tools can filter patterns based on volume, volatility, and market cap criteria to focus on the most tradeable setups.
Alert systems notify traders when specific candlestick patterns form on their watchlists, enabling real-time response to market opportunities. Mobile trading platforms allow traders to act on candlestick indicator signals from anywhere, ensuring they can capitalize on time-sensitive pattern formations regardless of location.
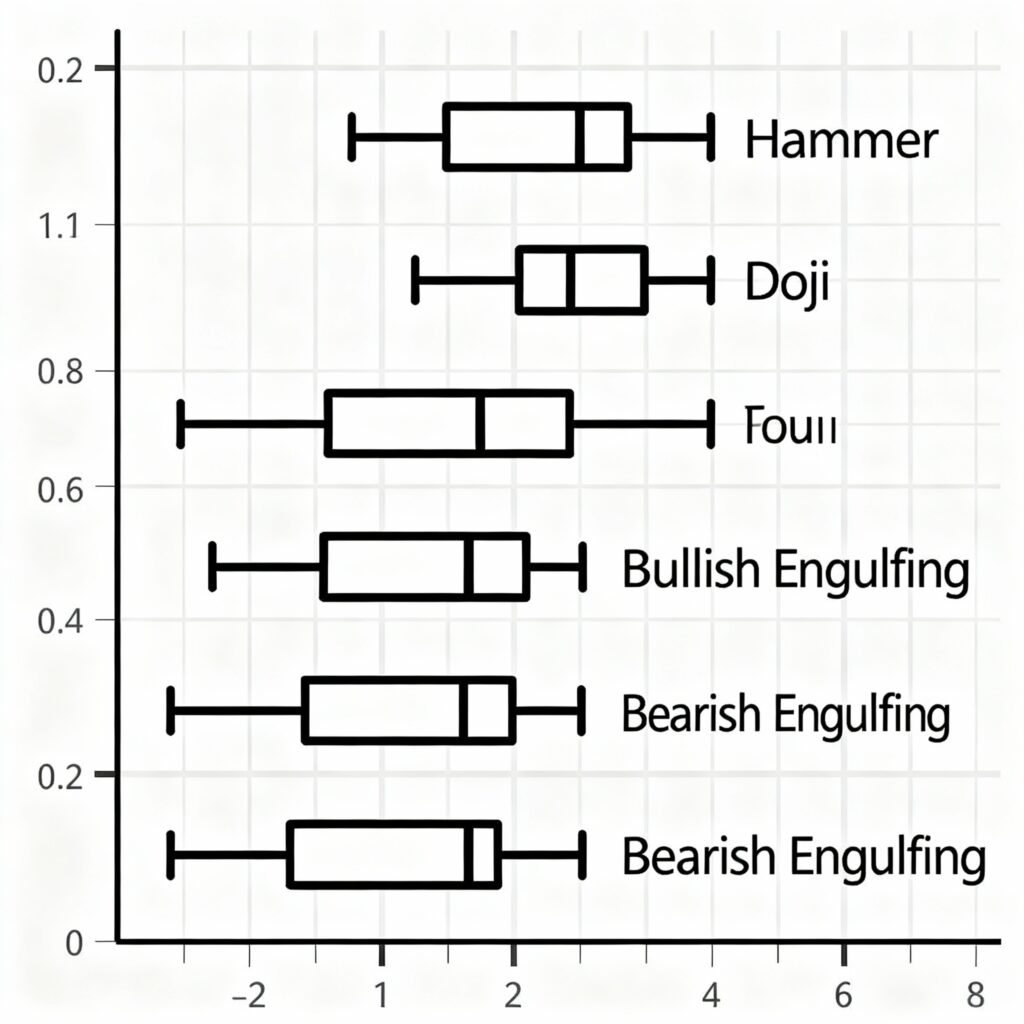
Candlestick patterns trading chart showing various indicators and formations
Conclusion
Mastering candlestick indicators requires dedication, practice, and a deep understanding of market psychology and technical analysis principles. These powerful visual tools provide traders with invaluable insights into market sentiment, trend reversals, and price movement patterns that can significantly improve trading results when properly applied. The key to success lies in combining candlestick pattern recognition with sound risk management, market context awareness, and systematic trading approaches.
Whether you’re identifying hammer patterns at support levels, recognizing engulfing signals at trend extremes, or interpreting doji formations during market indecision, candlestick indicators offer a comprehensive framework for understanding market dynamics. By developing expertise in pattern recognition and integrating these signals with other technical analysis tools, traders can build robust trading systems that capitalize on market inefficiencies and emotional extremes.
The journey to mastering candlestick indicators is ongoing, as markets constantly evolve and new patterns emerge. Successful traders remain committed to continuous learning, pattern study, and strategy refinement to maintain their competitive edge. With proper education, practice, and application, candlestick indicators can become powerful allies in your quest for consistent trading profitability and long-term market success.
Disclaimer: This article is for educational purposes only and should not be considered as financial advice. Trading in financial markets involves substantial risk and may not be suitable for all investors. Past performance of candlestick patterns does not guarantee future results. Always conduct your own research and consider consulting with qualified financial advisors before making investment decisions. The information provided here is based on historical analysis and market observations, but market conditions can change rapidly and unpredictably.
Keywords: candlestick indicators, technical analysis, trading patterns, bullish patterns, bearish patterns, hammer pattern, doji pattern, engulfing pattern, shooting star, morning star, evening star, market sentiment, price action, trend reversal, support resistance
Hashtags: #CandlestickIndicators #TechnicalAnalysis #TradingPatterns #StockMarket #TradingStrategy #BullishPatterns #BearishPatterns #MarketAnalysis #PriceAction #TradingEducation #FinancialMarkets #InvestmentStrategy #TrendAnalysis #TradingSignals #MarketPsychology