
Fibonacci Retracement: Trading The Ultimate Guide to Mastering Golden Ratio Levels
Fibonacci retracement stands as one of the most powerful and widely-used technical analysis tools in modern trading, offering traders a mathematical approach to identifying potential support and resistance levels. This sophisticated trading strategy, based on the famous Fibonacci sequence, provides traders with precise entry and exit points while managing risk effectively in volatile markets.
The Fibonacci retracement strategy helps traders identify key price levels where securities might pause, reverse, or continue trending, making it an essential tool for successful market participation. Understanding Fibonacci retracement levels enables traders to make informed decisions across various financial instruments, from stocks and forex to cryptocurrencies and commodities.
Understanding the Fibonacci Retracement, Sequence and Golden Ratio
The Fibonacci retracement methodology originates from the mathematical Fibonacci sequence, where each number equals the sum of the two preceding numbers: 0, 1, 1, 2, 3, 5, 8, 13, 21, 34, 55, 89, and so forth. This sequence reveals remarkable mathematical relationships that translate directly into market behavior.
The golden ratio, approximately 1.618, emerges from these Fibonacci retracement calculations and appears consistently throughout nature, architecture, and financial markets. When applied to trading, this Fibonacci retracement principle creates specific percentage levels that traders use to predict price movements with remarkable accuracy.
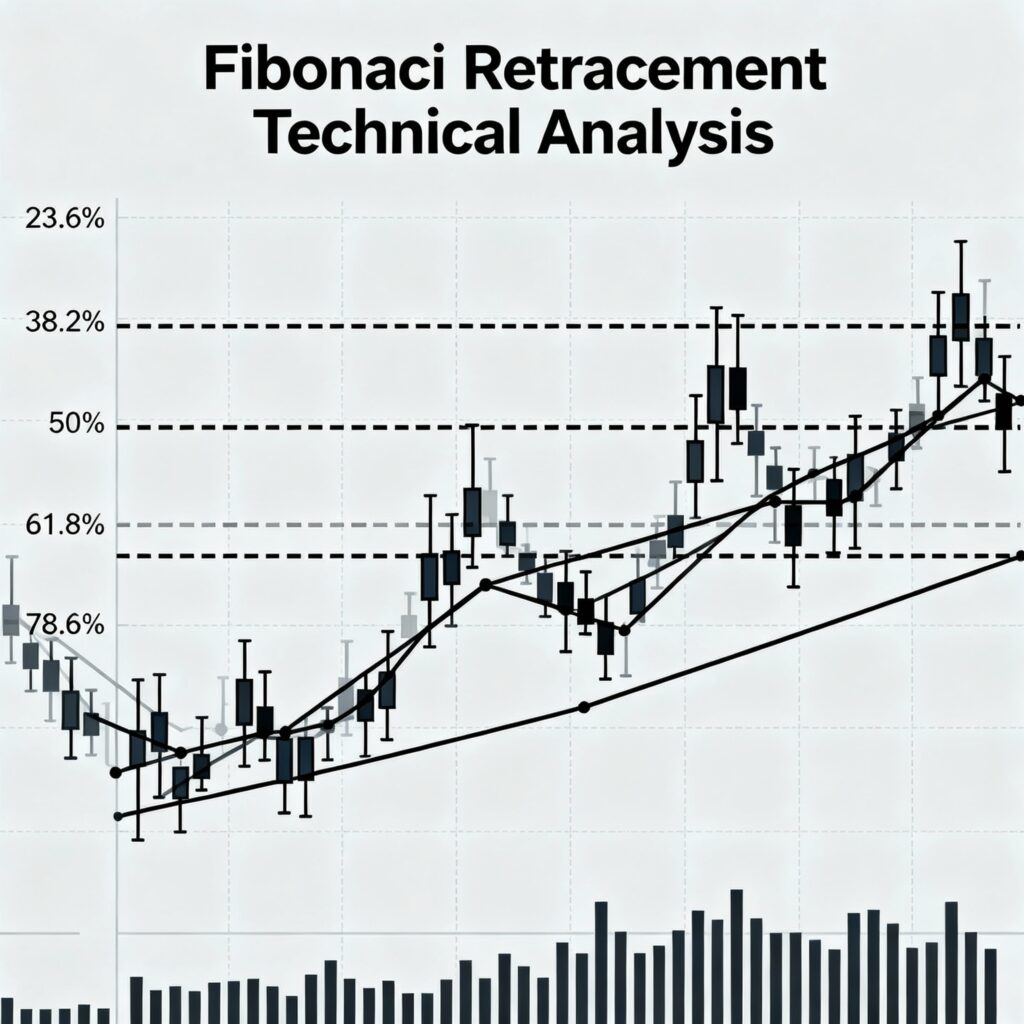
The key Fibonacci retracement levels include 23.6%, 38.2%, 50%, 61.8%, and 78.6%, with each percentage representing potential support or resistance zones. The 61.8% level, known as the “golden retracement level,” holds particular significance in Fibonacci retracement analysis due to its connection to the golden ratio.
Key Fibonacci Retracement Levels Explained
23.6% Fibonacci Retracement Level
The 23.6% Fibonacci retracement level represents a shallow pullback in strong trending markets. Traders often view this Fibonacci retracement level as an indication of robust momentum, where only minimal corrections occur before the trend continues. This shallow Fibonacci retracement level works best in aggressive trending environments.
38.2% Fibonacci Retracement Level
The 38.2% Fibonacci retracement level serves as a moderate correction zone, often considered a “buy-the-dip” opportunity for traders. This Fibonacci retracement level frequently acts as the first significant support or resistance area during market pullbacks, making it crucial for Fibonacci retracement strategy implementation.
50% Fibonacci Retracement Level
Although not technically a Fibonacci number, the 50% Fibonacci retracement level holds psychological significance in trading. This Fibonacci retracement level aligns with Dow Theory’s assertion that markets often retrace half their prior move, creating a powerful confluence point for Fibonacci retracement analysis.
61.8% Fibonacci Retracement Level
The 61.8% Fibonacci retracement level, the golden ratio, represents the most critical decision point in Fibonacci retracement strategy. This Fibonacci retracement level often serves as the final defense before trend invalidation, making it essential for risk management in Fibonacci retracement trading.
78.6% Fibonacci Retracement Level
The 78.6% Fibonacci retracement level indicates deep corrections that may signal potential trend reversals. Traders using Fibonacci retracement analysis often view this level as a last line of defense before considering the original trend invalid.
How to Draw Fibonacci Retracement Levels
Identifying Market Direction for Fibonacci Retracement
Successful Fibonacci retracement application begins with identifying the prevailing market trend. Traders must determine whether the market exhibits an uptrend with higher highs and higher lows, or a downtrend with lower highs and lower lows before applying Fibonacci retracement levels.
Selecting Swing Points for Fibonacci Retracement
Proper Fibonacci retracement drawing requires identifying significant swing highs and swing lows. A swing high forms when price reaches a peak followed by two consecutive lower highs, while a swing low occurs when price hits a trough followed by two consecutive higher lows in Fibonacci retracement analysis.
Drawing Fibonacci Retracement in Uptrends
For uptrending markets, Fibonacci retracement levels are drawn from the swing low to the swing high. Traders place the Fibonacci retracement tool at the bottom of the move and drag it to the peak, creating horizontal support levels at key Fibonacci retracement percentages.
Drawing Fibonacci Retracement in Downtrends
In downtrending markets, Fibonacci retracement levels are plotted from the swing high to the swing low. The Fibonacci retracement tool starts at the top of the move and extends down to the trough, establishing potential resistance levels for price bounces.
Fibonacci Retracement Trading Strategies
Entry Point Identification with Fibonacci Retracement
Fibonacci retracement strategy excels at identifying low-risk entry points during trending markets. Traders wait for price pullbacks to key Fibonacci retracement levels, particularly the 38.2%, 50%, and 61.8% zones, before entering positions in the direction of the primary trend.
Successful Fibonacci retracement entries require confirmation from additional technical indicators such as candlestick patterns, RSI oversold conditions, or volume spikes. This confluence approach strengthens Fibonacci retracement signals and reduces false breakout risks.
Stop Loss Placement in Fibonacci Retracement
Risk management in Fibonacci retracement trading involves placing stop losses just beyond the next Fibonacci retracement level. This approach protects against unexpected trend reversals while allowing normal price fluctuations within the Fibonacci retracement framework.
For example, if entering a long position at the 38.2% Fibonacci retracement level, traders typically place stops below the 50% Fibonacci retracement level to maintain favorable risk-reward ratios.
Profit Target Setting with Fibonacci Extensions
Fibonacci retracement analysis extends beyond retracement levels to include extension targets at 100%, 161.8%, and 261.8%. These Fibonacci retracement extensions help traders set objective profit targets when prices resume the original trend direction.
Practical Applications Across Markets
Stock Market Fibonacci Retracement
In stock trading, Fibonacci retracement levels help identify strategic entry and exit points during both uptrends and downtrends. Individual stocks often respect Fibonacci retracement levels due to algorithmic trading and widespread trader recognition of these mathematical relationships.
Forex Fibonacci Retracement
Currency pairs frequently demonstrate strong reactions at Fibonacci retracement levels due to the high liquidity and technical nature of forex markets. Major currency pairs like EUR/USD, GBP/USD, and USD/JPY often show precise reversals at key Fibonacci retracement percentages.
Cryptocurrency Fibonacci Retracement
Digital assets, despite their volatility, often respect Fibonacci retracement levels due to the technical trading nature of cryptocurrency markets. Bitcoin, Ethereum, and other major cryptocurrencies frequently find support or resistance at critical Fibonacci retracement zones.
Commodities Fibonacci Retracement
Precious metals like gold and silver, along with energy commodities, regularly demonstrate Fibonacci retracement behavior. These markets’ technical nature and institutional participation create strong reactions at Fibonacci retracement levels.
Advanced Fibonacci Retracement Techniques
Multiple Timeframe Fibonacci Retracement
Professional traders enhance Fibonacci retracement accuracy by analyzing multiple timeframes simultaneously. Higher timeframe Fibonacci retracement levels carry more weight and provide stronger support or resistance than shorter timeframe levels.
Confluence with Other Technical Indicators
Fibonacci retracement effectiveness increases when combined with moving averages, trend lines, and momentum oscillators. These confluence points create high-probability Fibonacci retracement setups that professional traders actively seek.
Fibonacci Retracement Pattern Recognition
Advanced Fibonacci retracement practitioners identify patterns where multiple Fibonacci retracement levels align across different timeframes or market swings. These Fibonacci retracement clusters often produce the most reliable trading signals.
Common Fibonacci Retracement Mistakes
Incorrect Swing Point Selection
The most frequent Fibonacci retracement error involves selecting inappropriate swing highs and lows. Traders must choose the most recent and significant price swings for accurate Fibonacci retracement level placement.
Ignoring Market Context
Successful Fibonacci retracement application requires understanding overall market conditions. Drawing Fibonacci retracement levels in choppy, sideways markets often produces unreliable signals compared to clear trending environments.
Over-reliance on Fibonacci Retracement
While Fibonacci retracement levels provide valuable insights, traders should never rely solely on these levels for trading decisions. Combining Fibonacci retracement with other technical analysis tools creates more robust trading strategies.
Risk Management with Fibonacci Retracement
Position Sizing in Fibonacci Retracement Trading
Proper Fibonacci retracement risk management involves calculating position sizes based on the distance between entry points and stop loss levels. This approach ensures consistent risk exposure regardless of the specific Fibonacci retracement level being traded.
Risk-Reward Ratios in Fibonacci Retracement
Successful Fibonacci retracement traders maintain minimum risk-reward ratios of 1:2 or better. The mathematical nature of Fibonacci retracement levels often provides favorable risk-reward opportunities when properly implemented.
Fibonacci Retracement Calculation Methods
Manual Fibonacci Retracement Calculation
Understanding Fibonacci retracement calculations helps traders better appreciate these levels’ significance. The basic Fibonacci retracement formula involves multiplying the price range by each Fibonacci percentage and subtracting from the high (downtrend) or adding to the low (uptrend).
For example, in a stock moving from $100 to $150, the 38.2% Fibonacci retracement level equals $150 – ($50 × 0.382) = $130.90.
Automated Fibonacci Retracement Tools
Modern trading platforms provide automated Fibonacci retracement tools that calculate and display these levels instantly. These tools eliminate calculation errors and allow traders to focus on Fibonacci retracement strategy implementation rather than mathematical computations.
Fibonacci Retracement Psychology
Market Psychology Behind Fibonacci Retracement
Fibonacci retracement levels work partly due to self-fulfilling prophecy effects, where widespread trader recognition creates actual support and resistance. Institutional algorithms and retail traders alike watch Fibonacci retracement levels, creating concentrated buying and selling pressure.
Algorithmic Trading and Fibonacci Retracement
High-frequency trading algorithms often incorporate Fibonacci retracement levels into their decision-making processes. This algorithmic participation strengthens Fibonacci retracement level significance and increases the probability of price reactions at these mathematical zones.
Keywords: fibonacci retracement, trading strategy, technical analysis, golden ratio, support levels, resistance levels, fibonacci levels, fibonacci sequence, fibonacci trading, market analysis
Hashtags: #FibonacciRetracement #TechnicalAnalysis #TradingStrategy #GoldenRatio #StockMarket #ForexTrading #CryptoTrading #TradingEducation #MarketAnalysis #TradingTips #FibonacciLevels #TradingStrategys #SupportResistance #PriceAction #TechnicalTrading
Disclaimer
This article is for educational purposes only and does not constitute financial advice. Fibonacci retracement trading involves substantial risk, and past performance does not guarantee future results. Always conduct thorough research and consider consulting with qualified financial advisors before making investment decisions. Fibonacci retracement strategies may not be suitable for all investors, and losses can exceed initial investments in leveraged trading scenarios.