Trading success often depends on the ability to read market sentiment and predict price movements. Candlestick patterns represent one of the most powerful tools in technical analysis, offering traders deep insights into market psychology and future price direction. These visual representations of price action have guided traders for centuries, providing reliable signals for both entry and exit points in various financial markets.
Understanding Candlestick Patterns Fundamentals
Candlestick patterns form the backbone of technical analysis, representing the battle between buyers and sellers in the market. Each candlestick displays four crucial price points: open, high, low, and close prices for a specific time period. The body of the candlestick patterns shows the difference between opening and closing prices, while the wicks or shadows extend to the period’s high and low points.
The psychology behind candlestick patterns reflects the collective emotions and behaviors of market participants. Fear and greed drive these formations, with each pattern telling a story about market sentiment and potential future movements. Understanding this psychological foundation helps traders interpret candlestick patterns more effectively and make better trading decisions.
Essential Bullish Candlestick Patterns
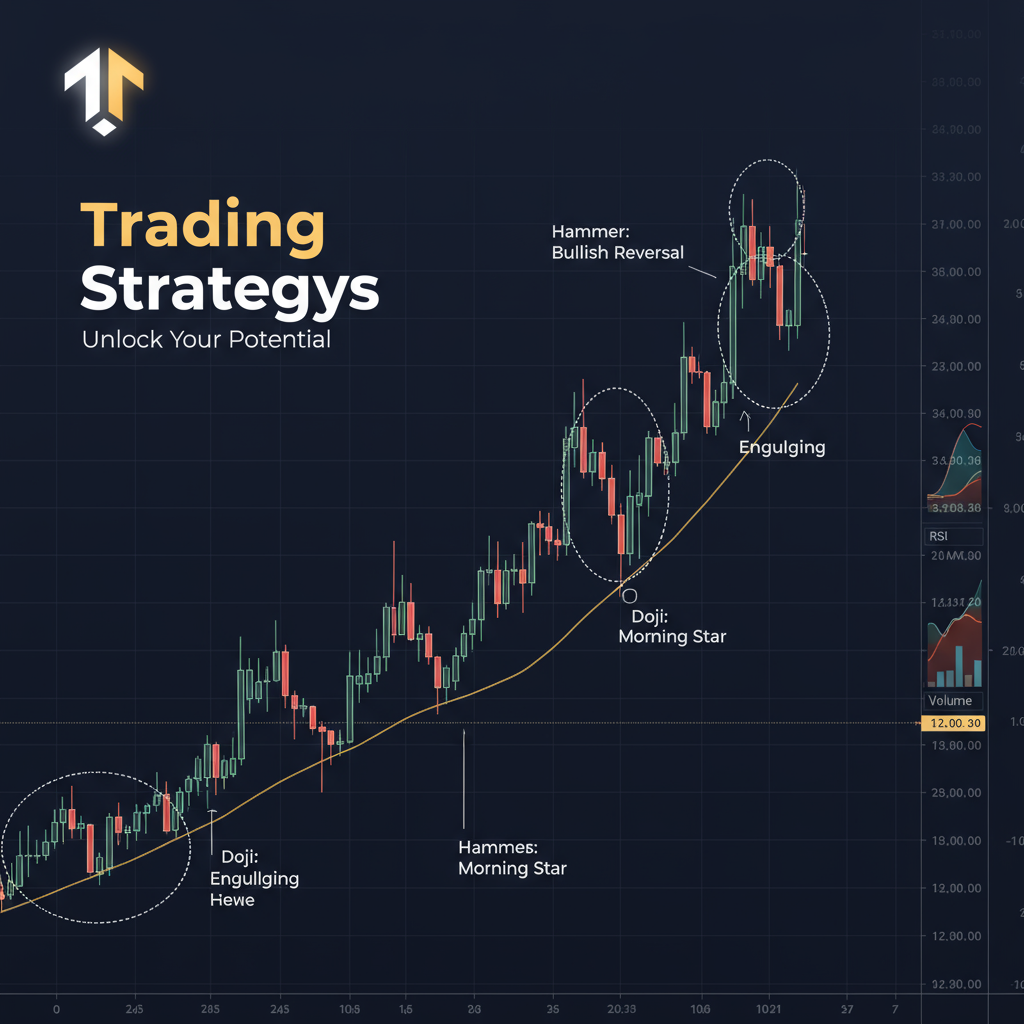
Hammer Pattern
The hammer represents one of the most reliable bullish candlestick patterns, featuring a small body with a long lower shadow. This pattern typically appears at the bottom of downtrends, indicating that despite selling pressure, strong buying interest pushed prices higher. The hammer’s candlestick patterns psychology shows that sellers initially controlled the session but buyers regained control by the close.
Bullish Engulfing Pattern
The bullish engulfing pattern consists of two candlestick patterns where a larger green candle completely engulfs a smaller red candle. This formation indicates a decisive shift from bearish to bullish sentiment, with buyers taking complete control of the market. The candlestick patterns signal becomes more reliable when accompanied by high trading volume.
Morning Star Pattern
The morning star represents a three-candle reversal formation among candlestick patterns, consisting of a long bearish candle, followed by a small-bodied candle, and completed by a strong bullish candle. This pattern signals the end of a downtrend and the beginning of potential upward movement. The candlestick patterns effectiveness increases when gaps appear between the candles.
Three White Soldiers
This powerful bullish continuation pattern features three consecutive long green candles with small shadows, each opening and closing higher than the previous day. The three white soldiers candlestick patterns indicate sustained buying pressure and strong upward momentum following a downtrend.
Critical Bearish Candlestick Patterns
Hanging Man Pattern
The hanging man shares the same shape as the hammer but appears at the top of uptrends among bearish candlestick patterns. This formation indicates that significant selling occurred during the session, though buyers managed to push prices back up. The hanging man warns that bulls may be losing control of the market.
Shooting Star Pattern
The shooting star features a small body with a long upper shadow, typically forming after uptrends in candlestick patterns. This pattern suggests that buyers pushed prices higher during the session, but sellers ultimately drove prices back down near the opening level. The candlestick patterns reliability increases with longer upper shadows.
Bearish Engulfing Pattern
This two-candle pattern shows a larger red candle completely engulfing a smaller green candle, indicating a shift from bullish to bearish control. The bearish engulfing pattern among candlestick patterns signals potential trend reversal, especially when occurring near resistance levels with high volume confirmation.
Evening Star Pattern
The evening star mirrors the morning star but signals bearish reversals in candlestick patterns. This three-candle formation consists of a bullish candle, followed by a small-bodied candle, and completed by a strong bearish candle. The pattern indicates that buying momentum is fading and selling pressure is increasing.
Advanced Candlestick Patterns Trading Strategies
Doji Patterns and Market Indecision
Doji candlestick patterns form when opening and closing prices are virtually identical, creating a cross-like appearance. These patterns indicate market indecision and potential trend reversals when appearing after strong moves. Different types of doji patterns include the gravestone doji, dragonfly doji, and long-legged doji, each providing specific insights into market sentiment.
Three Black Crows Pattern
This bearish continuation pattern features three consecutive long red candles with small wicks, indicating strong selling pressure. The three black crows candlestick patterns suggest that the previous uptrend is ending and a downtrend is beginning. Each candle should close lower than the previous candle for maximum effectiveness.
Piercing Line Pattern
The piercing line consists of a long bearish candle followed by a bullish candle that opens below the previous close but closes above the midpoint of the bearish candle. This candlestick patterns formation indicates strong buying pressure and potential bullish reversal when appearing at the bottom of downtrends.
Market Psychology Behind Candlestick Patterns
Understanding the psychological aspects of candlestick patterns provides traders with significant advantages. Each pattern reflects the emotional battle between bulls and bears, with formations revealing moments of fear, greed, optimism, and despair. Successful traders learn to read these emotional signals and position themselves accordingly.
The collective behavior of market participants creates self-fulfilling prophecies in candlestick patterns. When many traders recognize the same pattern and act accordingly, their combined actions often drive prices in the predicted direction. This herd behavior amplifies the effectiveness of well-known patterns while creating opportunities for contrarian strategies.
Practical Trading Applications
Volume Confirmation
Volume plays a crucial role in validating candlestick patterns signals. High volume accompanying a pattern formation indicates strong conviction behind the move, while low volume suggests weak participation and higher probability of false signals. Traders should always analyze volume alongside candlestick patterns for better accuracy.
Multiple Time Frame Analysis
Analyzing candlestick patterns across different time frames improves trading accuracy significantly. Patterns appearing on longer time frames generally carry more weight than those on shorter periods. Successful traders often look for pattern confirmation across multiple time frames before making trading decisions.
Risk Management with Candlestick Patterns
Proper risk management remains essential when trading candlestick patterns. Setting stop-loss levels based on pattern structure helps limit potential losses while allowing profits to run. For example, hammer patterns typically use the low of the hammer as a stop-loss level.
Common Trading Mistakes to Avoid
Over-Reliance on Single Patterns
One of the most frequent mistakes involves relying solely on individual candlestick patterns without considering broader market context. Successful trading requires combining pattern analysis with other technical indicators, trend analysis, and market fundamentals for comprehensive decision-making.
Ignoring Market Context
Trading candlestick patterns in isolation without considering overall market trends often leads to poor results. Patterns gain significance when analyzed within the context of prevailing market conditions, support and resistance levels, and fundamental factors.
Pattern Misinterpretation
Many traders struggle with correctly identifying and interpreting candlestick patterns. Taking time to study pattern characteristics and practice identification skills helps avoid costly mistakes. Understanding the subtle differences between similar patterns prevents misinterpretation.
Success Rates and Statistical Analysis
Research analyzing millions of trades reveals that candlestick patterns can achieve success rates between 54-70% depending on market conditions and proper application. The most reliable patterns include the inverted hammer (60% success rate), bearish marubozu (56.1%), and gravestone doji (57%).
Studies show that candlestick patterns effectiveness has evolved over time, with success rates declining in algorithmic trading environments but experiencing resurgence during volatile market periods. Modern traders must adapt their pattern analysis to current market conditions for optimal results.
Technology and Pattern Recognition
Modern trading platforms offer automated candlestick patterns recognition tools that help identify formations across multiple markets simultaneously. However, traders should combine automated detection with manual analysis to avoid false signals and improve accuracy.
Artificial intelligence and machine learning algorithms increasingly support candlestick patterns analysis, helping traders process vast amounts of data quickly. These technological advances enhance traditional pattern recognition while maintaining the fundamental principles of candlestick analysis.
Building a Comprehensive Trading Strategy
Successful candlestick patterns trading requires developing a systematic approach that incorporates pattern recognition, risk management, and market analysis. Traders should focus on mastering a few reliable patterns rather than trying to learn every possible formation.
Creating a trading plan that defines entry and exit criteria based on candlestick patterns helps maintain discipline and consistency. This plan should include position sizing rules, stop-loss levels, and profit targets appropriate for different market conditions.
Advanced Pattern Combinations
Professional traders often analyze combinations of candlestick patterns to identify higher-probability trading opportunities. For example, a morning star pattern followed by bullish continuation patterns suggests strong upward momentum and extended rally potential.
Pattern filtering techniques help separate high-quality signals from noise in candlestick patterns analysis. These methods involve confirming patterns with additional technical indicators, volume analysis, and market structure examination for improved accuracy.
Keywords: candlestick patterns, technical analysis, trading signals, market psychology, bullish patterns, bearish patterns, price action, trading strategy, pattern recognition, market sentiment
Hashtags: #CandlestickPatterns #TechnicalAnalysis #TradingSignals #StockMarket #PriceAction #TradingEducation #MarketAnalysis #TradingStrategy #FinancialMarkets #TradingTips
Disclaimer
This article is provided for educational purposes only and should not be considered as financial advice. Candlestick patterns analysis involves substantial risk, and past performance does not guarantee future results. Traders should conduct their own research, develop proper risk management strategies, and consider consulting with financial professionals before making investment decisions. The financial markets are inherently unpredictable, and trading based on candlestick patterns or any technical analysis method can result in significant losses. Always trade with money you can afford to lose and never risk more than you can handle financially.