Master Candlestick Formation Patterns: Complete Trading Guide for Technical Analysis Success
Candlestick formation patterns represent one of the most powerful and widely-used tools in technical analysis, providing traders with invaluable insights into market sentiment and potential price movements. These visual representations of price action have been utilized for centuries, originally developed by Japanese rice traders, and continue to serve as fundamental building blocks for modern trading strategies. Understanding candlestick formation patterns is essential for any serious trader looking to improve their market analysis capabilities and make more informed trading decisions.
Understanding the Foundation of Candlestick Formation Patterns
Candlestick formation patterns are created by combining individual candlesticks to form recognizable shapes that signal potential market reversals or continuations. Each candlestick formation pattern tells a story about the battle between buyers and sellers, revealing crucial information about market psychology and future price direction. The effectiveness of candlestick formation patterns lies in their ability to capture market sentiment in a visual format that traders can quickly interpret and act upon.
Types of Candlestick Formation Patterns
Candlestick formation patterns fall into three primary categories that help traders understand different market conditions:
Bullish Candlestick Formation Patterns signal potential upward price movements and indicate that buyers are gaining control of the market. These candlestick formation patterns typically appear at the bottom of downtrends and suggest that selling pressure is diminishing while buying interest is increasing.
Bearish Candlestick Formation Patterns indicate potential downward price movements and suggest that sellers are taking control from buyers. These candlestick formation patterns usually form at the top of uptrends and signal that buying momentum is weakening while selling pressure is building.
Indecision Candlestick Formation Patterns show market uncertainty where neither buyers nor sellers have clear control. These candlestick formation patterns often precede significant market moves and require additional confirmation before traders can determine the likely direction.
Essential Bullish Candlestick Formation Patterns
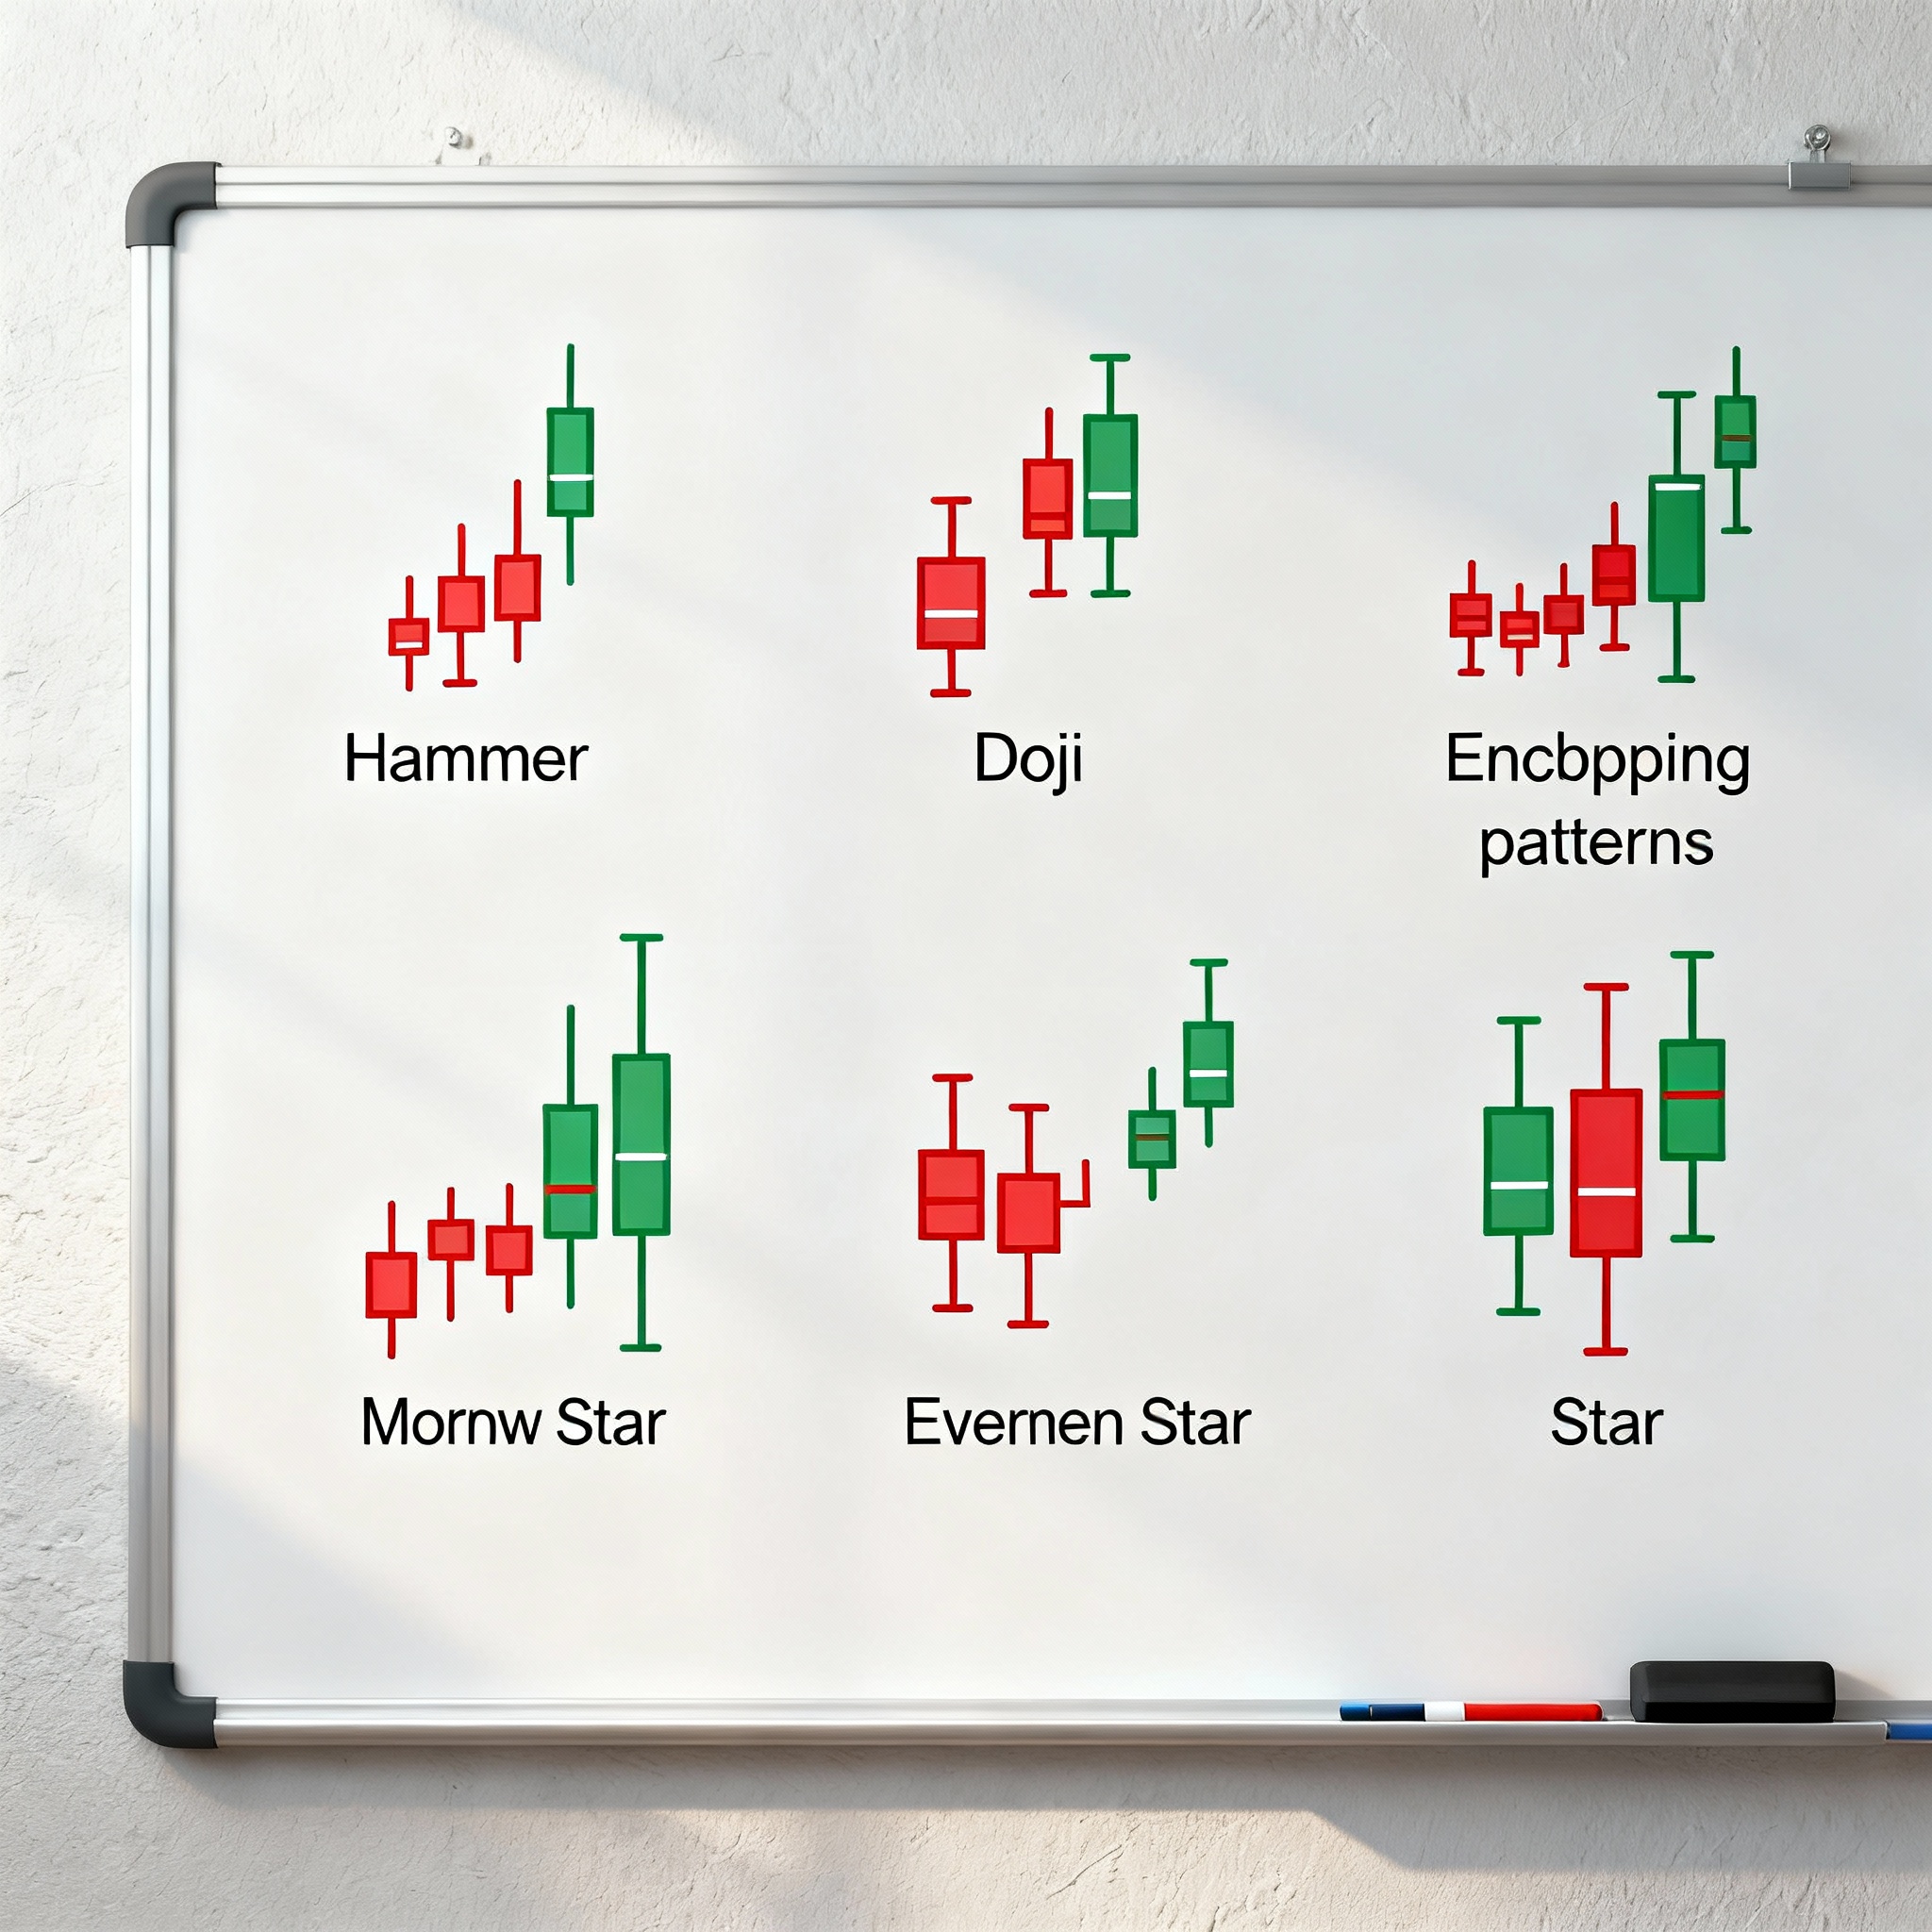
Hammer Pattern
The hammer represents one of the most reliable bullish candlestick formation patterns, characterized by a small body at the top with a long lower shadow that’s at least twice the body’s length. This candlestick formation pattern appears after a downtrend and indicates that sellers initially pushed prices lower, but buyers stepped in to drive prices back up near the opening level. The hammer candlestick formation pattern suggests that the downtrend may be ending and an upward reversal could be imminent.
Bullish Engulfing Pattern
The bullish engulfing represents a powerful two-candle candlestick formation pattern where a large green candle completely engulfs the previous small red candle. This candlestick formation pattern demonstrates that buyers have overwhelmed sellers and taken control of the market. According to research, the bullish engulfing candlestick formation pattern has approximately a 68% success rate in predicting bullish reversals when it appears after a clear downtrend.
Morning Star Pattern
The morning star is a three-candle candlestick formation pattern that signals a strong bullish reversal. This candlestick formation pattern consists of a long red candle, followed by a small-bodied candle (often a doji), and completed by a long green candle that closes well above the first candle’s midpoint. The morning star candlestick formation pattern indicates that selling pressure has exhausted and buyers are ready to take control.
Piercing Line Pattern
The piercing line is a two-candle bullish candlestick formation pattern where a green candle opens below the previous red candle’s low but closes above its midpoint. This candlestick formation pattern shows that despite initial selling pressure, buyers managed to push prices significantly higher, suggesting a potential trend reversal.
Critical Bearish Candlestick Formation Patterns
Shooting Star Pattern
The shooting star represents a significant bearish candlestick formation pattern that appears at the top of uptrends. This candlestick formation pattern features a small body near the bottom with a long upper shadow, indicating that buyers initially pushed prices higher but sellers regained control to close near the session’s low. The shooting star candlestick formation pattern warns that the uptrend may be losing momentum and a reversal could occur.
Bearish Engulfing Pattern
The bearish engulfing is a powerful two-candle candlestick formation pattern where a large red candle completely engulfs the previous small green candle. This candlestick formation pattern indicates that sellers have overtaken buyers and gained market control. The bearish engulfing candlestick formation pattern is particularly significant when it appears after a strong uptrend and near resistance levels.
Evening Star Pattern
The evening star represents a three-candle bearish candlestick formation pattern that signals potential trend reversal from bullish to bearish. This candlestick formation pattern starts with a long green candle, followed by a small-bodied candle showing indecision, and concludes with a long red candle that closes well below the first candle’s midpoint. The evening star candlestick formation pattern suggests that buying momentum has peaked and sellers are taking control.
Dark Cloud Cover
The dark cloud cover is a two-candle bearish candlestick formation pattern where a red candle opens above the previous green candle but closes below its midpoint. This candlestick formation pattern indicates a shift in market sentiment from bullish to bearish, with sellers becoming more aggressive.
Advanced Candlestick Formation Patterns
Three White Soldiers
The three white soldiers is a powerful bullish candlestick formation pattern consisting of three consecutive long green candles. Each candle in this candlestick formation pattern opens within the previous candle’s body and closes higher, demonstrating strong and consistent buying pressure. The three white soldiers candlestick formation pattern indicates a robust bullish reversal when it appears after a downtrend.
Three Black Crows
The three black crows represents the bearish equivalent of three white soldiers, featuring three consecutive long red candles. This candlestick formation pattern shows strong and consistent selling pressure, with each candle opening within the previous candle’s body and closing lower. The three black crows candlestick formation pattern signals a powerful bearish reversal when it forms after an uptrend.
Doji Patterns
Doji candlestick formation patterns occur when opening and closing prices are nearly identical, creating a cross-like appearance. These candlestick formation patterns indicate market indecision and often signal potential reversals, especially when they appear after strong trends. Various types of doji candlestick formation patterns include the standard doji, long-legged doji, dragonfly doji, and gravestone doji.
Trading Strategies Using Candlestick Formation Patterns
Confirmation and Entry Points
Successful trading with candlestick formation patterns requires proper confirmation before entering positions. Traders should wait for the candlestick formation pattern to complete and look for additional confirmation through volume analysis, technical indicators, or price action. Entry points for bullish candlestick formation patterns typically occur when price breaks above the pattern’s high, while bearish patterns signal entries when price breaks below the pattern’s low.
Risk Management with Candlestick Formation Patterns
Effective risk management is crucial when trading candlestick formation patterns. Stop-loss levels for bullish candlestick formation patterns should be placed below the pattern’s low, while bearish patterns require stops above the pattern’s high. Position sizing should reflect the reliability of the specific candlestick formation pattern and overall market conditions.
Combining Patterns with Technical Analysis
Candlestick formation patterns work best when combined with other technical analysis tools. Support and resistance levels, trend lines, moving averages, and momentum indicators can provide additional confirmation for candlestick formation patterns. This multi-faceted approach increases the probability of successful trades based on candlestick formation patterns.
Common Mistakes and How to Avoid Them
Pattern Recognition Errors
Many traders make mistakes when identifying candlestick formation patterns, leading to false signals and losses. Proper education and practice are essential for accurately recognizing authentic candlestick formation patterns versus similar-looking but invalid formations. Traders should study historical charts and practice identifying candlestick formation patterns in different market conditions.
Ignoring Market Context
Candlestick formation patterns must be analyzed within the broader market context to be effective. A bullish candlestick formation pattern appearing in a strong downtrend may not be as reliable as one forming near significant support levels. Understanding the overall market structure and trend direction is crucial for properly interpreting candlestick formation patterns.
Psychology Behind Candlestick Formation Patterns
Market Sentiment Analysis
Candlestick formation patterns reveal the underlying psychology driving market movements. Each pattern tells a story about the emotions and decisions of market participants, from fear and greed to uncertainty and confidence. Understanding this psychological aspect helps traders better interpret candlestick formation patterns and predict future price movements.
Crowd Behavior and Pattern Formation
The formation of candlestick formation patterns reflects collective market behavior and the constant struggle between buyers and sellers. When enough traders recognize and act on specific candlestick formation patterns, it can become a self-fulfilling prophecy that reinforces the pattern’s effectiveness. This crowd psychology is what gives candlestick formation patterns their predictive power in financial markets.
Timeframe Considerations for Candlestick Formation Patterns
Short-term vs Long-term Patterns
Candlestick formation patterns can appear on any timeframe, from minute charts to monthly charts, but their significance varies accordingly. Patterns forming on higher timeframes generally carry more weight and reliability than those on lower timeframes. Traders should consider their trading style and objectives when choosing which timeframe to focus on for candlestick formation patterns.
Multiple Timeframe Analysis
Using multiple timeframes to analyze candlestick formation patterns can significantly improve trading results. A bullish candlestick formation pattern on a daily chart supported by similar patterns on weekly charts provides stronger confirmation than patterns appearing in isolation. This comprehensive approach helps filter out false signals and identify higher-probability trading opportunities.
Hashtags: #CandlestickPatterns #TechnicalAnalysis #TradingStrategies #StockMarket #ForexTrading #CryptocurrencyTrading #TradingEducation #MarketAnalysis #PriceAction #TradingSignals #BullishPatterns #BearishPatterns #TradingTips #InvestmentStrategies #FinancialMarkets
Disclaimer: This article is provided for educational purposes only by Trading Strategys and should not be considered as financial advice. Trading in financial markets involves substantial risk and may not be suitable for all investors. Past performance of candlestick formation patterns does not guarantee future results. Always conduct your own research and consider consulting with a qualified financial advisor before making any trading decisions. The information presented here is based on historical market data and technical analysis principles, but market conditions can change rapidly and unpredictably.